PC version manual
table of contents
1. Login
1.1. How to log in
1.2. Proxy server settings
2. Home screen
2.1. Viewer
2.2. Toolbar
2.3. Layers
2.4. Layer information
2.5. Camera button
2.6. View tools
3. Basic operations
3.1. Importing LA01 and LA03 shooting data
3.1.1 When importing by drag and drop
3.1.1 When installing by selecting a folder from Explorer
3.2.1 LA01 data
3.2.1.1 Marker
3.2.2 LA03 data
3.2.2.1 Shooting route
3.2.2.2 Video
3.2. Importing a single point cloud
4. Function
4.1. Open
4.2. Save
4.2.1 Save the point cloud
4.2.2 Save lines and polygons
4.3. Synthesis
4.4. Cross section
4.5. Tree top detection
4.6. Contour lines
4.7. Orthorectification
4.8. DTM creation
4.9. DSM creation
4.10. OBJ creation
4.11. TIFF resizing
4.12 CAD functions
4.12.1 Back
4.12.2 Forward
4.12.3 Edit
4.12.4 points
4.12.5 Line segment
4.12.6 Polygon
4.12.7 Rectangle
4.12.8 Curve
4.12.9 Automatic detection
4.12.10 Settings
4.12.11 Save
4.12.12 Reset magnification
4.13 LiDAR-Camera Calibration
4.14. Simple measurement
4.14.1 Distance/area measurement
4.14.2 Volume measurement
4.15. Point cloud cut
4.15.1 Select the deletion range and cut the point cloud
4.15.2 Cut a point cloud using markers
4.16. Coordinate transformation
4.16.1 Translation
4.16.2.1 Click to select source coordinates
4.16.2.2 Manually input and select source coordinates
4.16.2 Helmert transformation
4.16.2.1 For Helmert transformation during fixed shooting
4.16.2.2 For Helmert transformation during moving shooting
4.16.3 Affine transformation
4.16.3.1 In the case of affine transformation during fixed shooting
4.16.3.2 Affine transformation during moving shooting
4.17. Tree detection
4.17.1 Tree detection method
4.17.1.1 When detecting standing trees within the clicked range
4.17.1.2 When detecting standing trees by specifying the length of the selection range
4.17.1.3 When measuring a specified range from the route
4.17.1.4 When detecting standing trees within the marker range
4.17.1.5 About the standing tree detection setting screen
4.17.2 Standing tree detection result screen
4.17.2.1 Standing tree detection result screen explanation
4.17.2.2 How to edit standing tree detection results
4.17.2.3 How to add standing tree detection results
4.17.2.3 How to output standing tree detection results as a Shape file
4.18. Laser drone
4.18.1 Loading laser drone (M1) data
4.18.2 Creating orthoimages from laser drone (M1) data
1. Login
1.1. How to log in
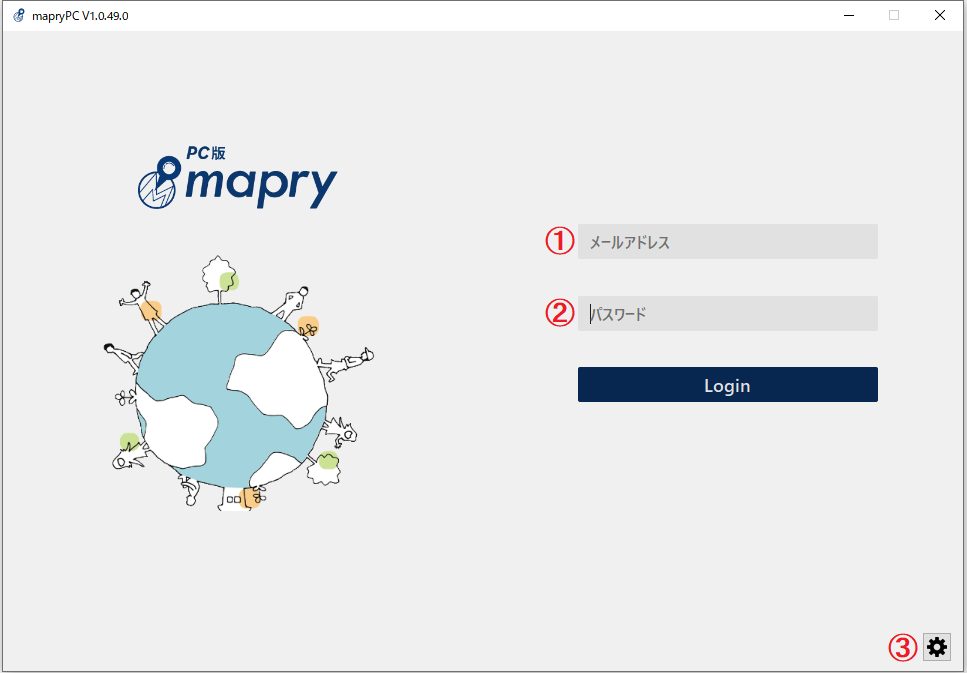
When you start mapry PC version, the login screen will be displayed.
Please enter the email address of the mapry account for which the mapry PC version has been activated in ① and the password in ②.
〇If you are unable to log in or have registered with mapry using an address other than your email address, we apologize for the inconvenience, but we would appreciate it if you could contact us using the contact information below.
TEL:0795-86-7515
E-mail:support@mapry.co.jp
1.2. Proxy server settings
1.Press the button ③ to display the proxy server settings screen. 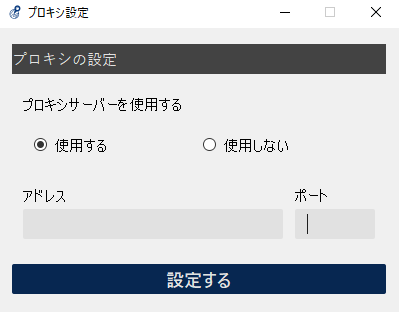
2. Select “Use a proxy server”.
3. After entering the address and port of the proxy server to be used, press the Set button to apply the proxy server settings.
After setting, please log in by entering your email address and password on the login screen.
*If you receive the error "Connection error. Please check your network settings.", the proxy server settings may be incorrect.
4. If you want to return to not using a proxy server, select "Do not use" on the proxy settings screen and press the button to set.
2. Home screen
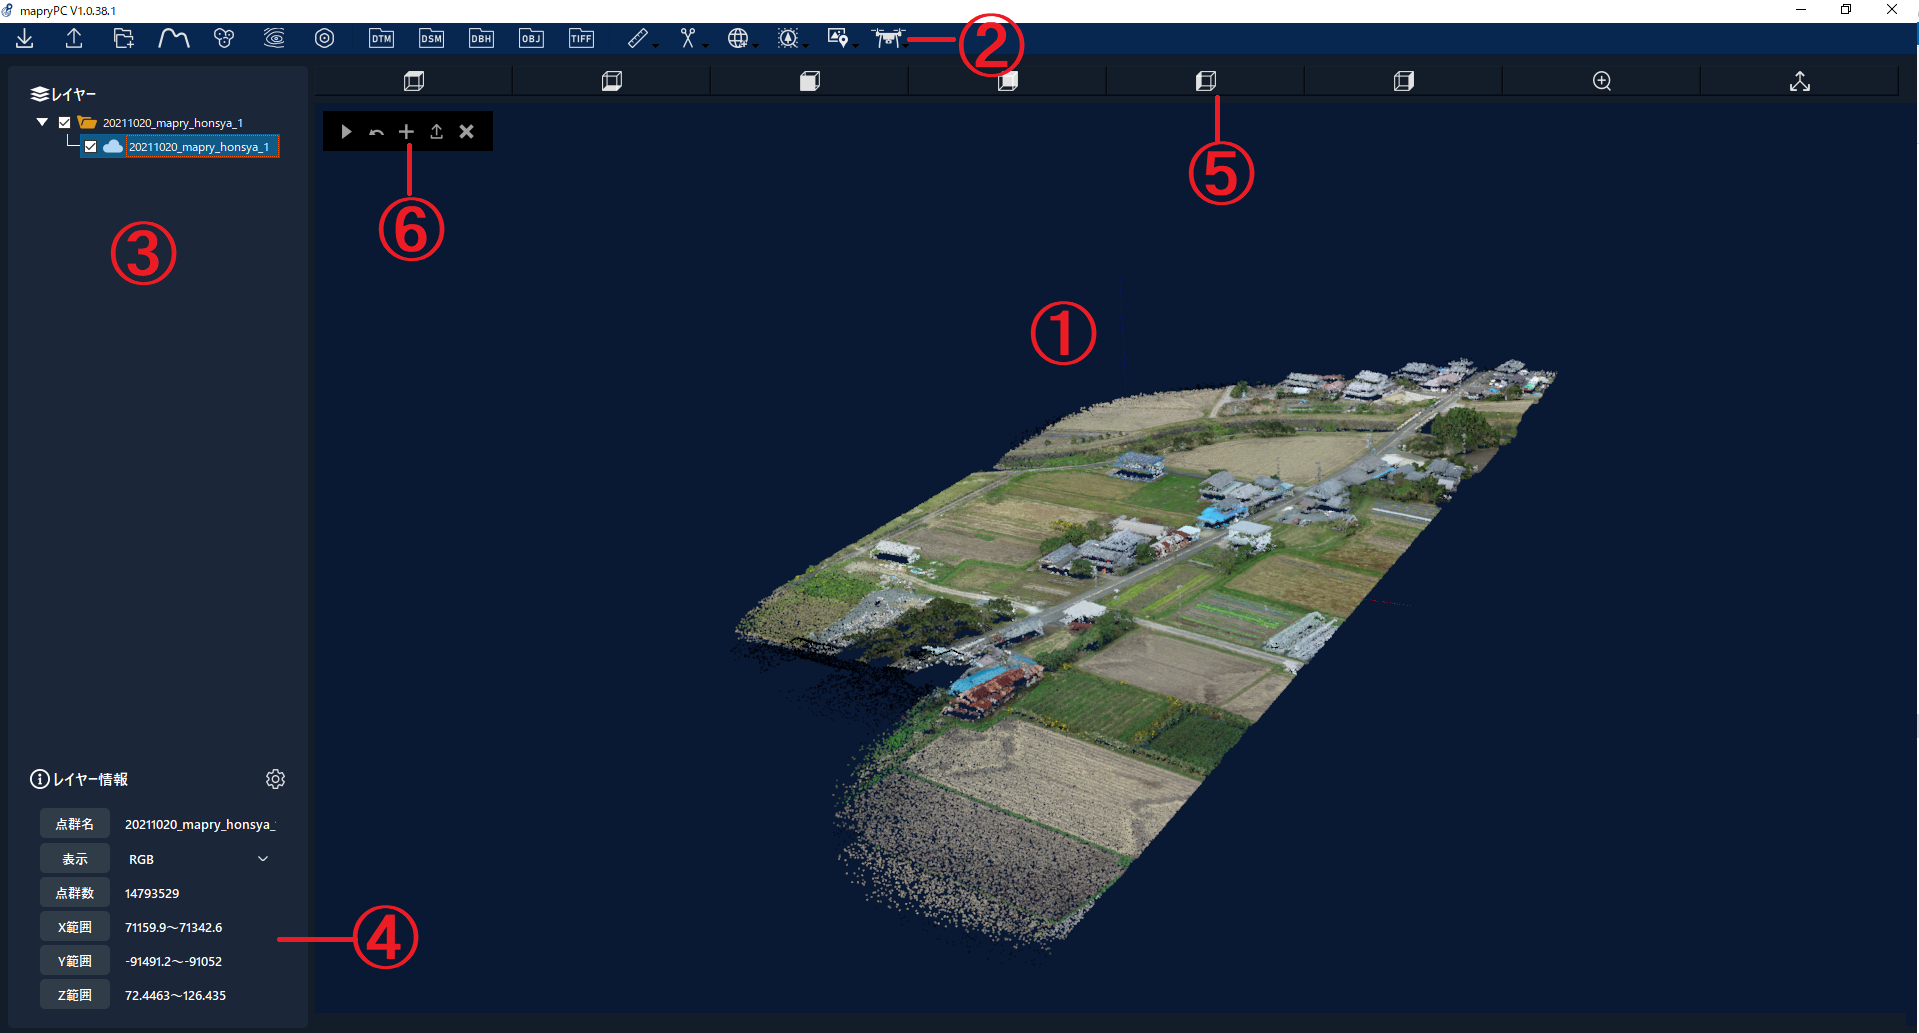
① viewer
② toolbar
③ layer
④ Layer information
⑤ Sub toolbar
⑥ View toolbar
2.1. Viewer
Imported data such as LA01 and LA03 shooting data and point clouds will be displayed.
You can also import some data by dragging and dropping it onto the viewer. For more information, please check the basic operations .
2.2. Toolbar
Buttons for various point cloud processing.
Details are explained in the functions below. 
① open
② keep
③ synthesis
④ Cross section
⑤ Tree top detection
⑥ contour
⑦ Ortho correction
⑧ DTM creation
⑨ DSM creation
⑩ OBJ creation
⑪ TIFF resize
⑫ CAD function
⑬ LiDAR-Camera Calibration
⑭ Simple measurement
⑮ point cloud cut
⑯ Coordinate transformation
⑰ Standing tree detection
⑱ marker import
⑲ laser drone
2.3. Layers
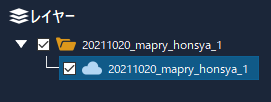
You can turn on/off the point cloud on the viewer using the checkbox to the left of the file name.
Click on the file name and if it lights up in light blue, it will be processed. 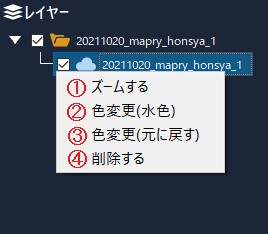
When you right-click on the file name, the following four menus are available for the target data.
① Zoom The camera moves to the location where the selected point cloud is focused.
② Change color Change the color of the point cloud to light blue.
③ Change color (restore) Change the color of the point cloud from light blue to the original color.
④Delete Delete the point cloud from the layer.
2.4. Layer information
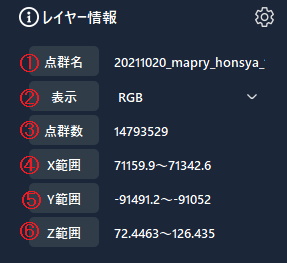
Information about the selected point cloud is displayed.
By selecting ① point cloud name ② select button, you can change the display to RGB base or reflection intensity base. (Reflection intensity is limited to retained data)
③Number of point groups ④X coordinate range ④Y coordinate range ⑤Z coordinate range
2.5. Camera button

①~⑥Move the camera to the viewpoint according to each icon ⑦Zoom button Zoom to the center of the camera. ⑧ Axis display switching
2.6. View tools

① Start button Used to start processing for some functions ② Back button Used to return processing for some functions ③ Add button ④ Export button Used when exporting analysis results ⑤ Finish button Used to start processing for some functions Used when exiting
3. Basic operations
3.1. Importing LA01 and LA03 shooting data
3.1.1 When importing by drag and drop
By dragging and dropping the folder created when shooting with LA01 or LA03 onto the viewer, you can import all the captured data including point clouds.
*If you run the mapry PC version with administrator privileges, you may not be able to import files using drag and drop.
In that case, install by selecting a folder from Explorer .
3.1.1 When installing by selecting a folder from Explorer
Click the import mark on the left end of the toolbar, click Load Folder (LA01/LA03), and then select the folder to import. 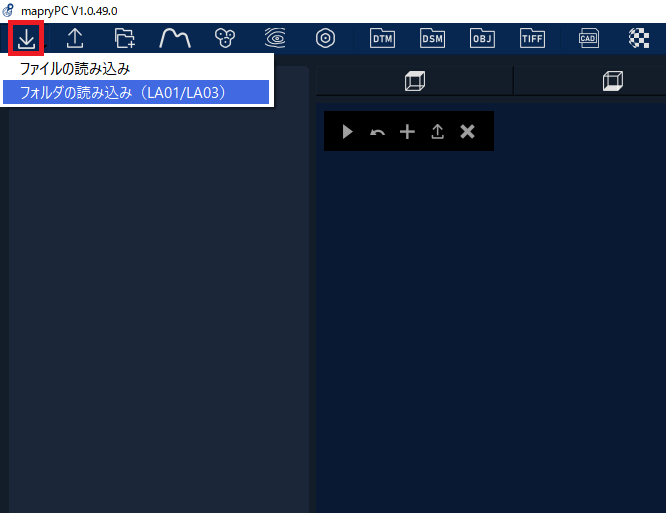
3.2.1 LA01 data
When importing from drag and drop or Explorer, "Loading point cloud..." is displayed. 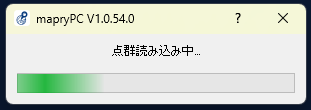
When loading is complete, the message "Do you want to correct the point cloud?" will be displayed. 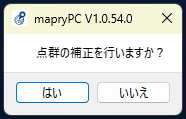
This correction uses the GNSS coordinates of the marker to correct the deviation of the IMU coordinates.
Since the IMU uses relative coordinates from the measurement start point, it has the disadvantage that once a deviation occurs, it will continue to accumulate until the end of the measurement. To solve this problem, it is necessary to reset the deviation using GNSS, which is an absolute coordinate.
Since markers are used for correction, the more markers you place during measurement, the more accurate the correction will be.
Reference site: https://mogist.kkc.co.jp/word/8cd9ef04-1495-44ea-bd98-f59b84f036ad.html
However, in rare cases, the corresponding GNSS and IMU coordinates may deviate due to a malfunction in the measurement equipment, resulting in a state where the point cloud appears to be drifting. In that case, click "No" and do not make any corrections.
3.2.1.1 Marker
A “marker” will be added to the layer, and the marker placed during shooting will be displayed. 
If you left-click the marker while holding down the Shift key, the captured image will be displayed in a separate window. 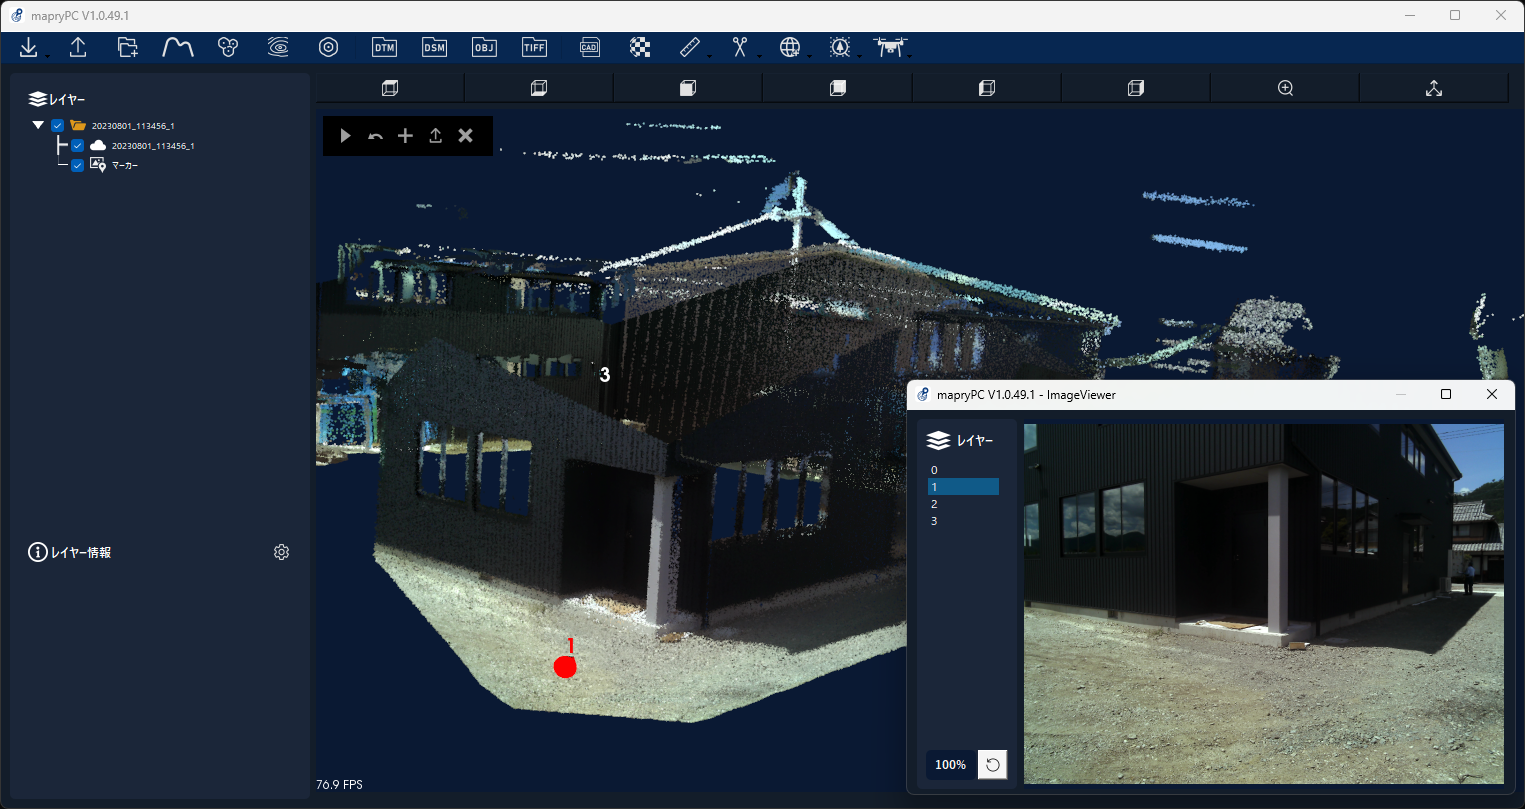
3.2.2 LA03 data
3.2.2.1 Shooting route
A "shooting route" will be added to the layer, and the route taken when shooting LA03 will be displayed as a red line on the viewer. 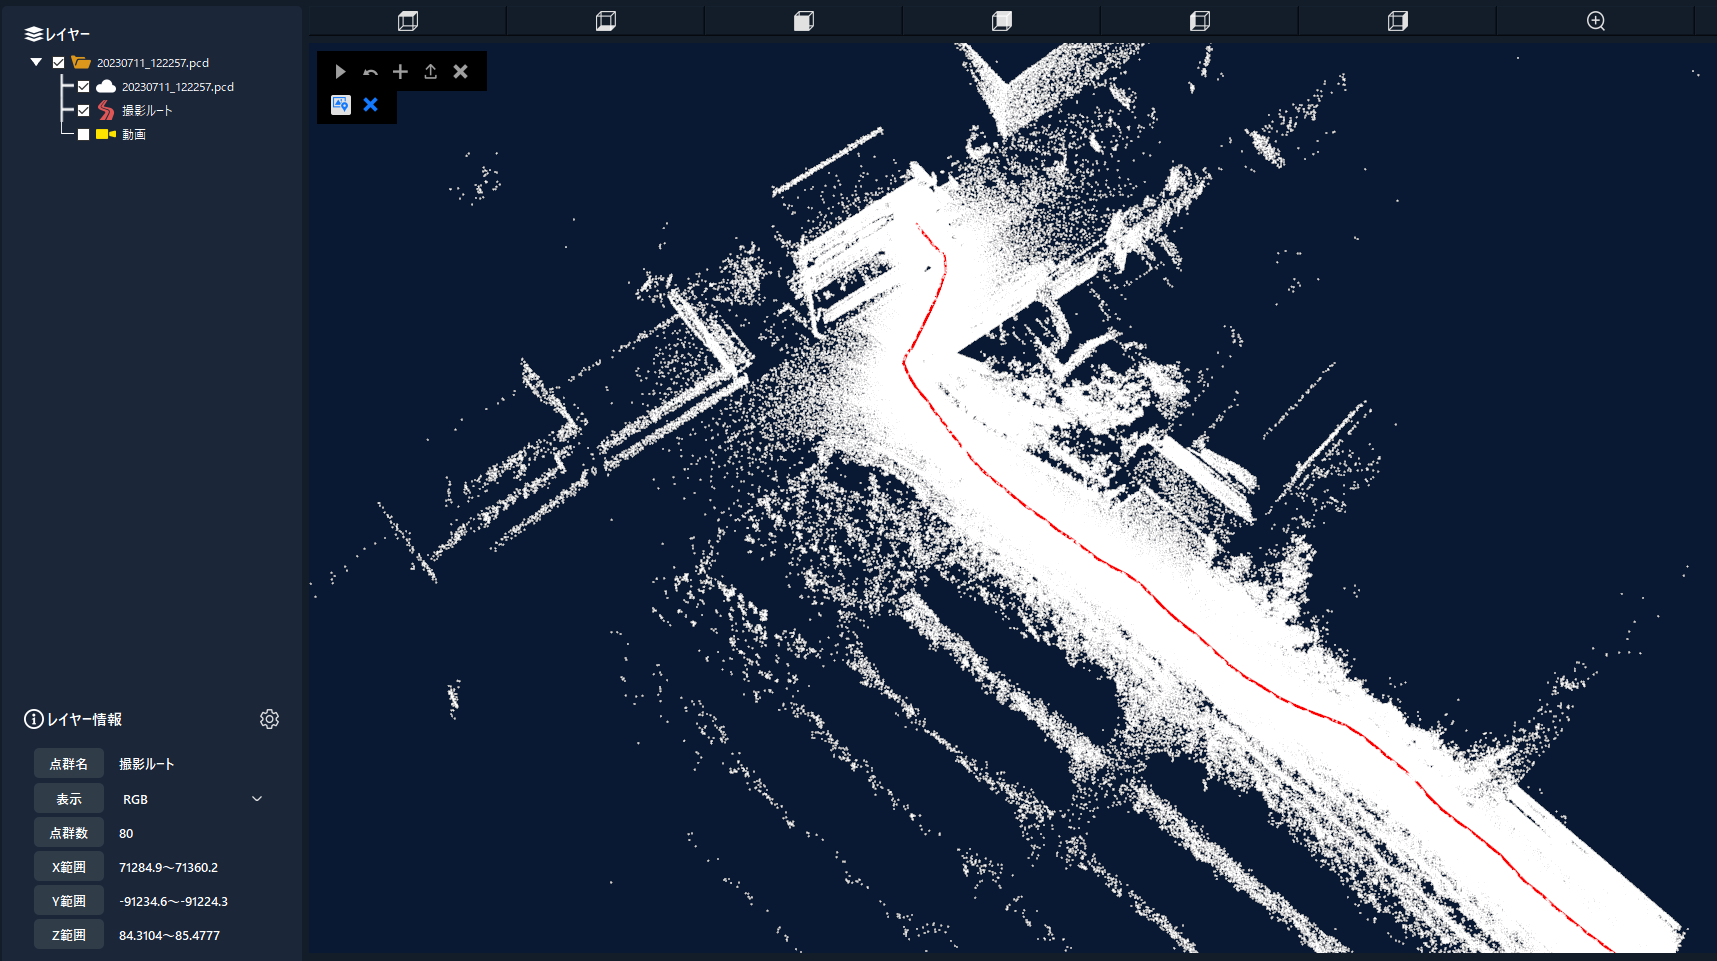
3.2.2.2 Video
A "video" will be added to the layer, the shot video will be displayed in a separate window, and the coordinates of the playing time will be displayed as a blue marker on the viewer. 
Explain the functions of the media player. 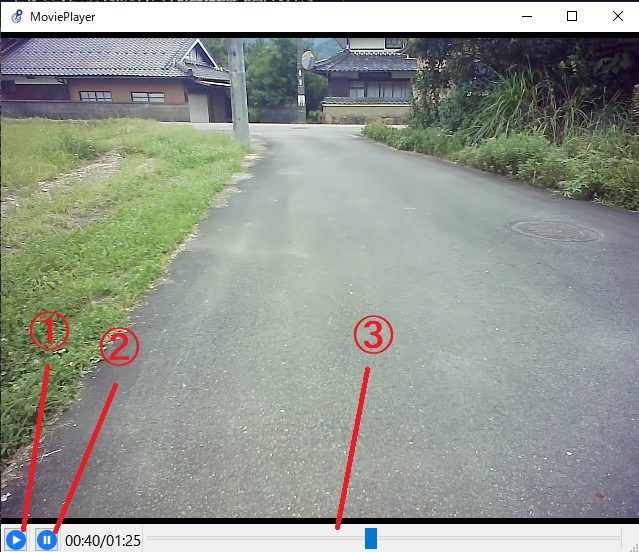
① Play button The video starts playing.
②Pause button The video playback will be temporarily stopped.
③Playback bar You can change the video playback time by moving the bar.
3.2. Importing a single point cloud
You can import point clouds by dragging and dropping them onto the viewer or by selecting a file from the import icon.
Supported extensions are PLY, PCD, LAS, and TXT.
*When displaying point clouds shot with LA01 and LA03, please import them using the method for importing shooting data with LA01 and LA03 .
Point clouds imported individually are not corrected and some functions cannot be used.
4. Function
4.1. Open 
You can select and import point cloud files. Supported extensions are PLY, PCD, LAS, and TXT.
*Uploading to a directory is only supported by drag and drop.
1.Press the Open icon.
2. A file dialog will appear, so select the path of the file you want to open, the point cloud will start loading, and the point cloud will be displayed.
4.2. Save 
4.2.1 Save the point cloud
You can save the point cloud by specifying the save destination.
Supported extensions are PLY, PCD, LAS, and TXT.
1. With the point cloud you want to save active on the layer, press the save icon.
2.A file dialog will appear, so select the path you want to save it to.
3.You can decide the extension to save by changing the file type at the bottom of the file dialog. 
4.Click "Save" at the bottom right of the file dialog to save.
4.2.2 Save lines and polygons
1.Press the save icon.
2.The CAD data output setting screen will be displayed, so enter the necessary items.
① A file dialog will be displayed, so select the save destination as .dxf. ② You can select whether to output as a cross-sectional view or a plan view.
③You can select the DXF version.
④You can choose whether to output in mm or m.
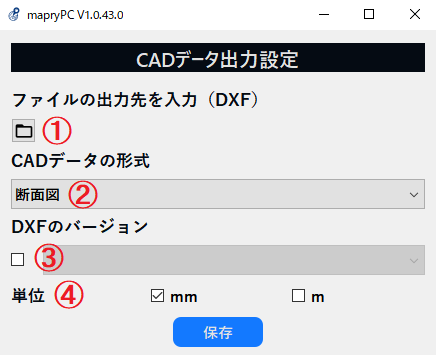
3. After completing the input of the necessary items, press the "Save button" and the DXF file will be saved in the selected location.
4.3. Synthesis 
This is a function that combines two imported point clouds.
When compositing, there are three methods of coordinate transformation: Euclidean transformation, Helmert transformation, and affine transformation.
- Select two point clouds to use from the layer .
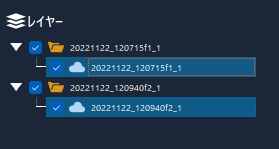
- Click on the compositing icon from the toolbar .

- The viewer will be split into two parts, left and right.
Right-click and select three corresponding points from each point group on the left and right. (4 points each in case of affine transformation)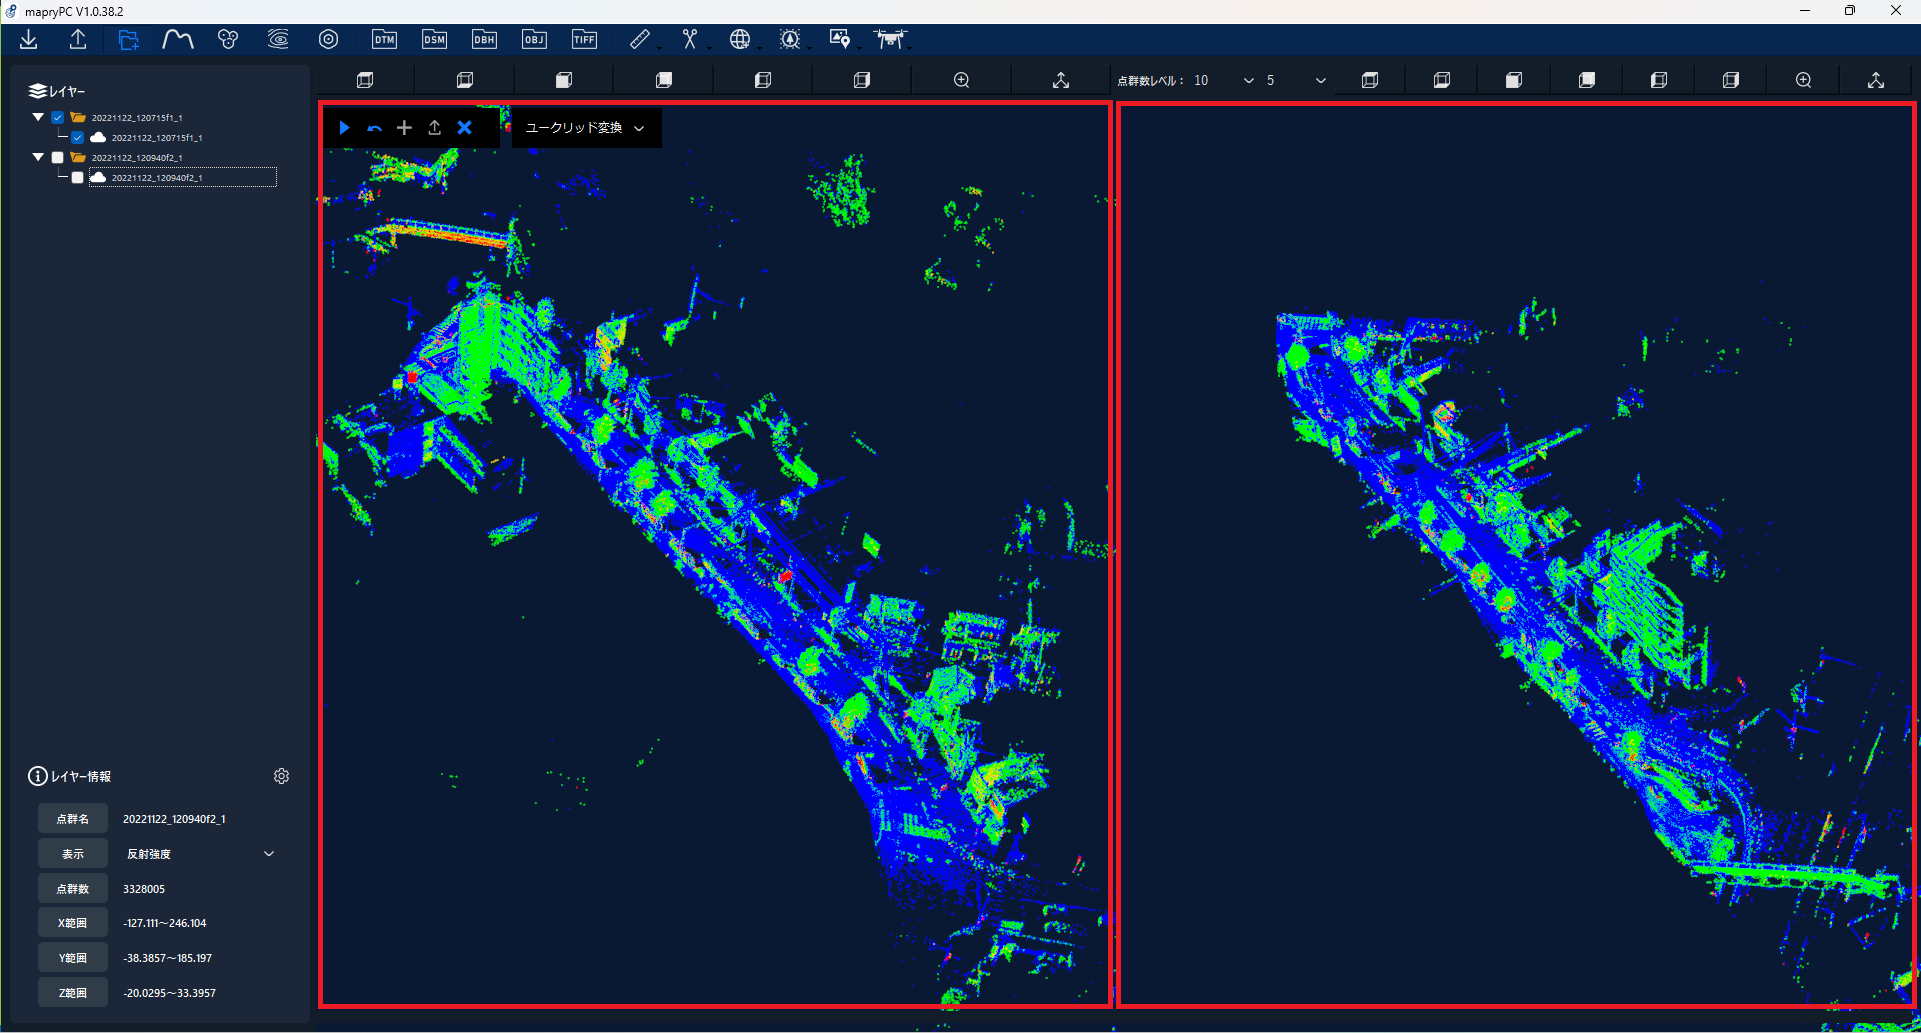
The method of coordinate transformation can be changed from the menu next to the view tool.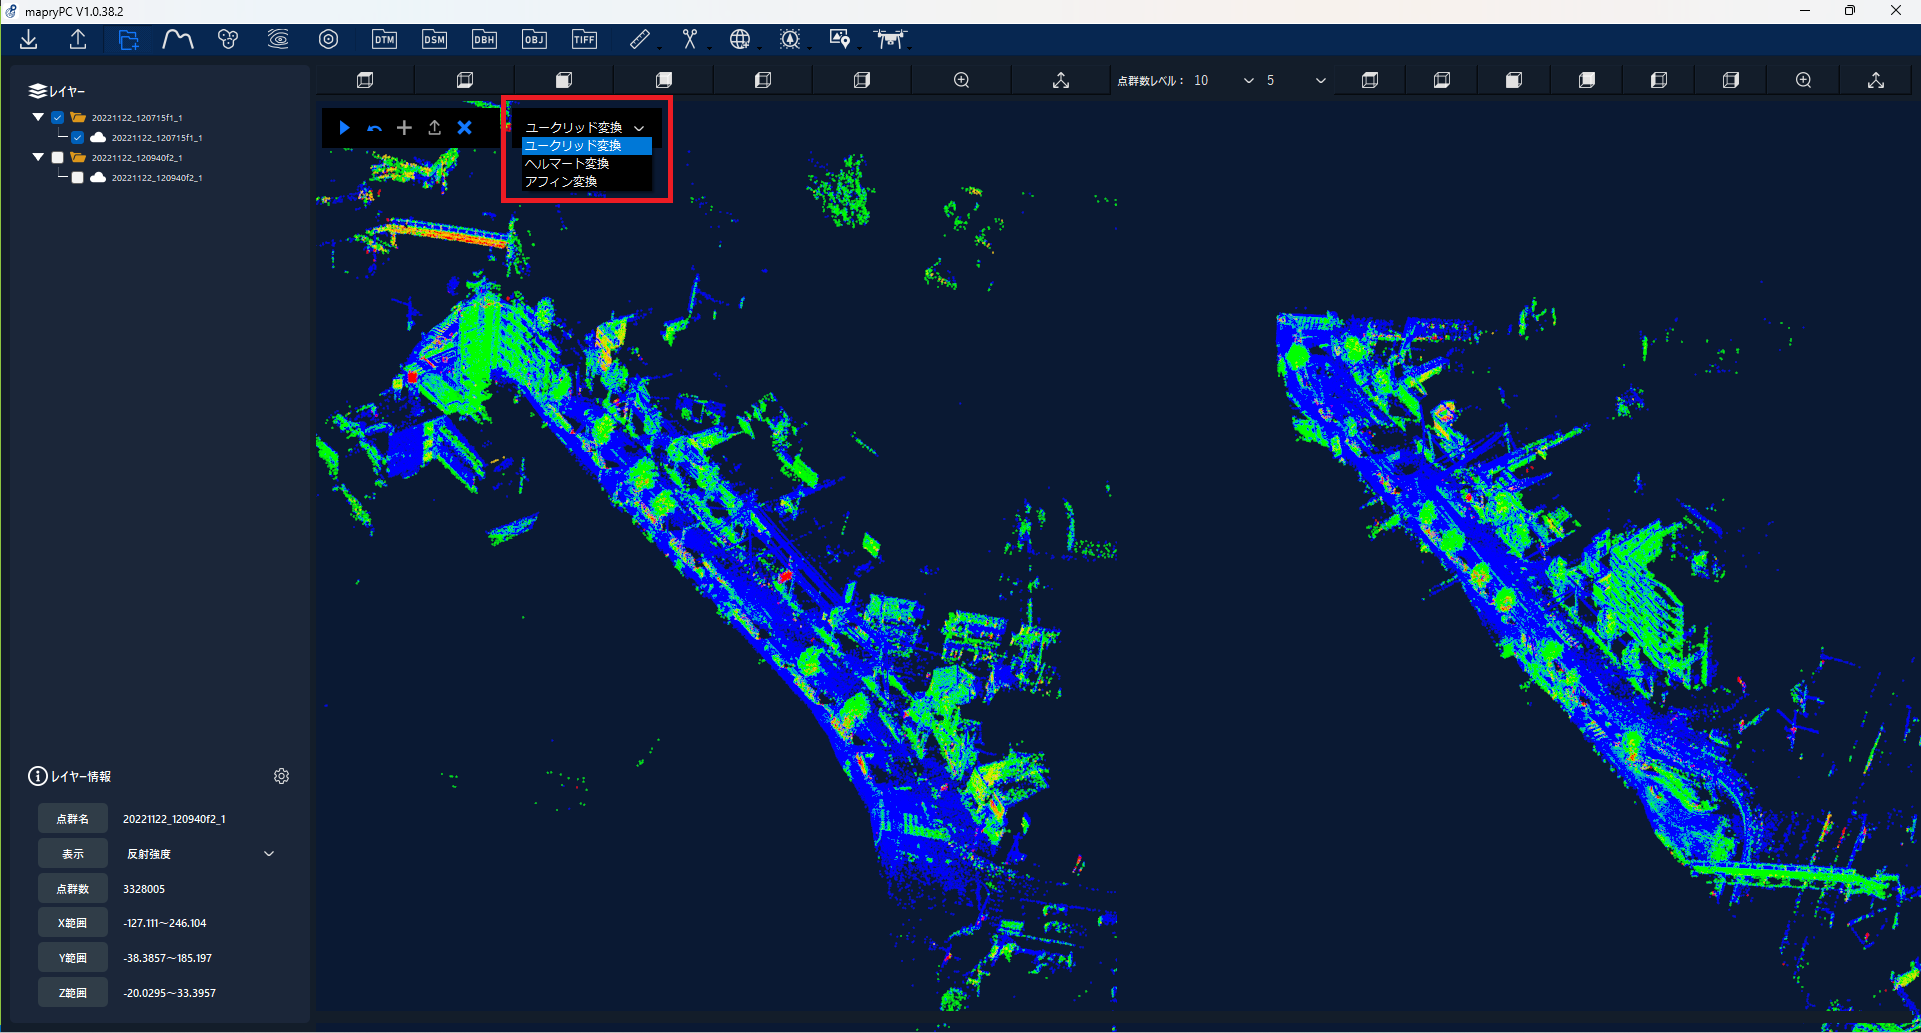
- After selecting the corresponding points, click the Start button on the View tool .
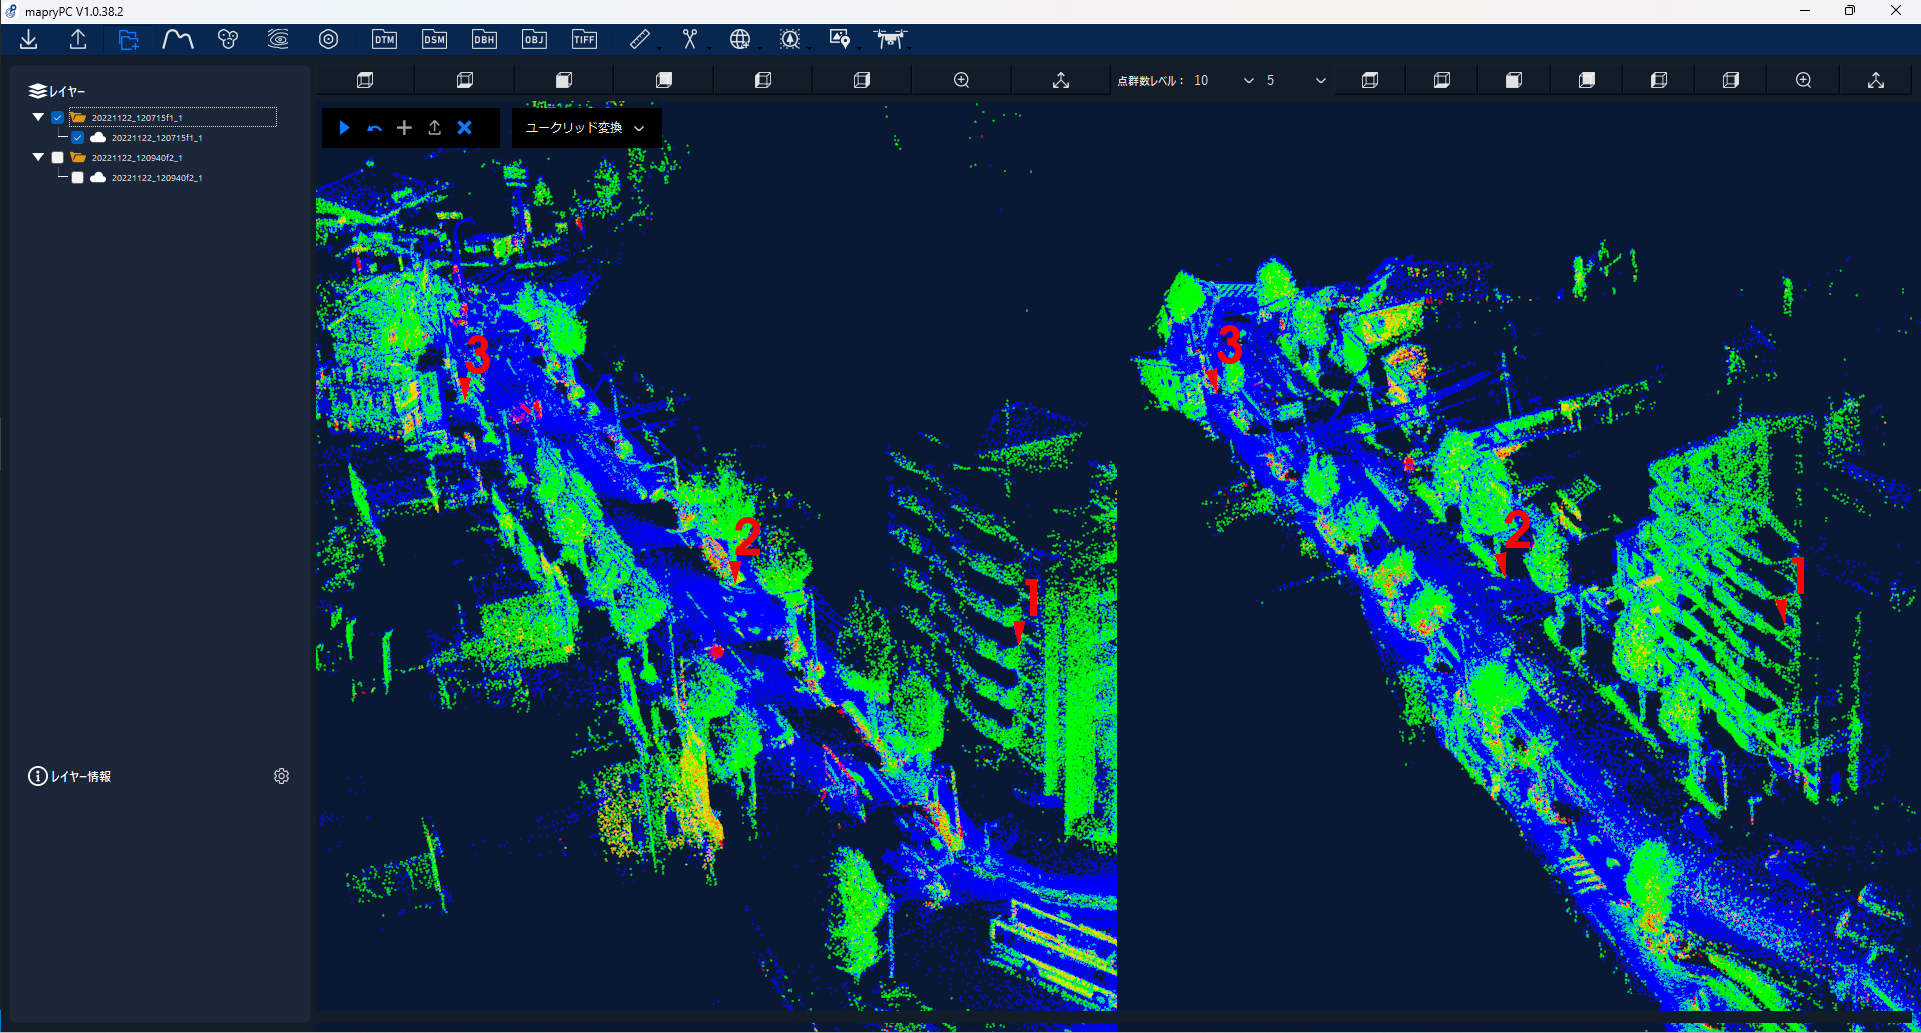
- The synthesis results will be displayed in a new window.
① Automatic positioning (ICP algorithm): Allows fine adjustment of composition.
② Save; You can save the synthesis results as a point cloud file.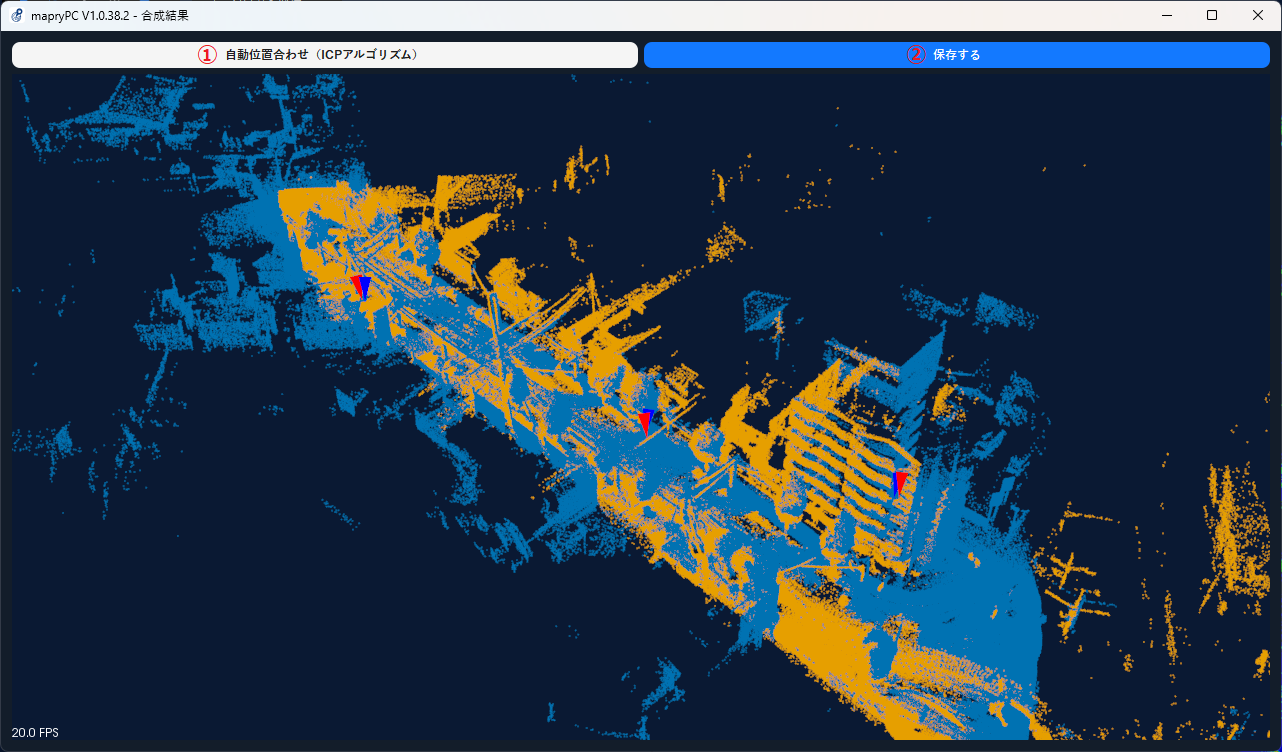
Additionally, the composite results are automatically added to the layer.
4.4. Cross section 
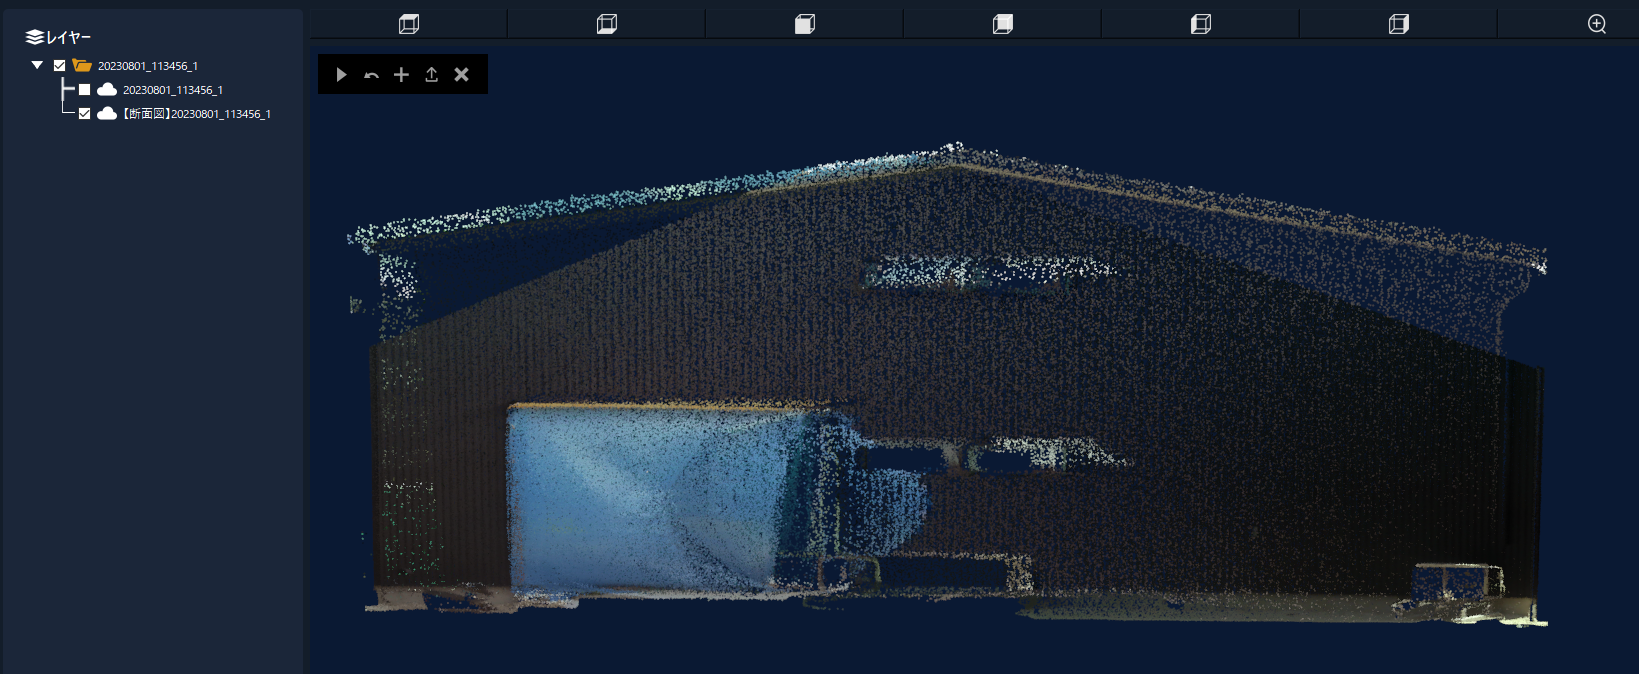
This function displays a cross-sectional view of the imported point cloud.
- Select the point cloud to use from the layer .

- Click the section view icon from the toolbar .

- Right-click and select the two points that will be the start and end points. After selecting two points, a two-dimensional cross-sectional view with the XY plane as the horizontal axis and the Z value as the vertical axis will be added to the layer.
4.5. Tree top detection 
This function detects the top of a tree from a point cloud obtained by a laser drone.
Calculate the location information, tree height, tree species, and estimate the diameter at breast height of the detected trees.
The detection results are output as a shape file (.shp).
- Click the Tree Top Detection icon from the toolbar .

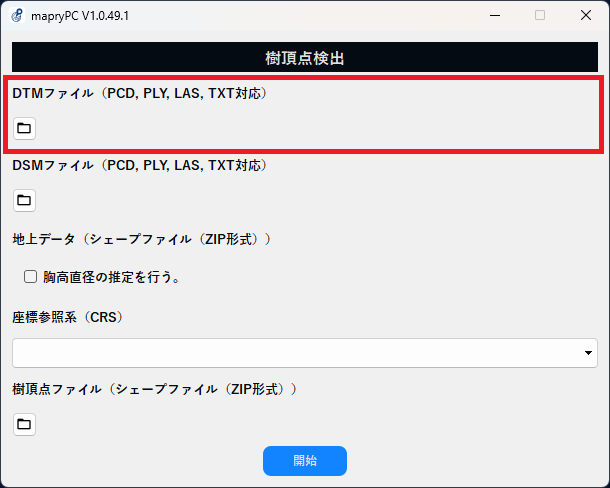
- Select the DTM point cloud file (.pcd, .ply, .las, .txt).
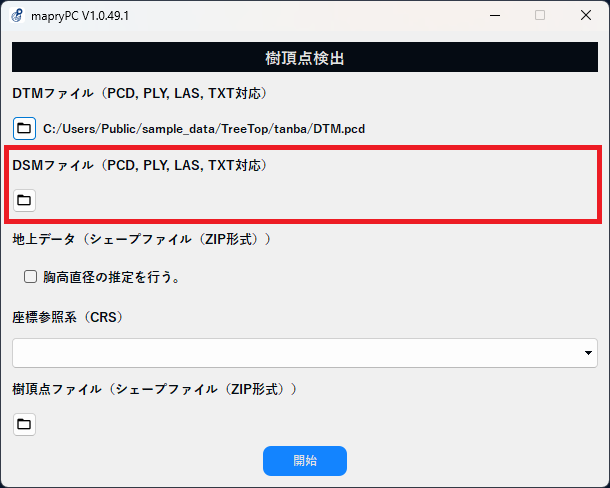
- Select the DSM point cloud file (.pcd, .ply, .las, .txt).
- If you want to estimate the diameter at breast height, please select ground data after checking the box.
For ground data, you can select the shapefile output from tree detection .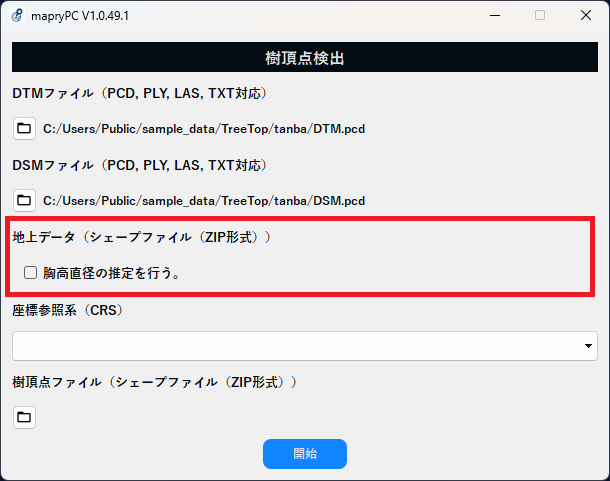
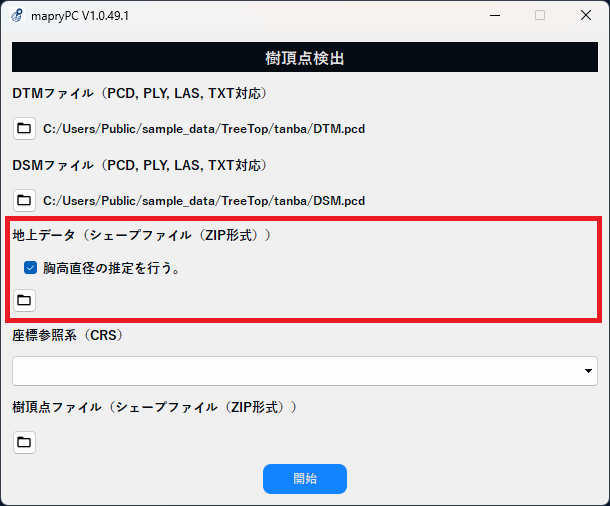
If there is no ground data, leave it unchecked and proceed to the next item. - Select the reference coordinate system (CRS).
The coordinate system can be selected from the Japanese Geodetic System 2011 system 1 (epsg:6669) to system 19 (epsg:6687).
If you do not know the coordinate system, leave it blank and proceed to the next item.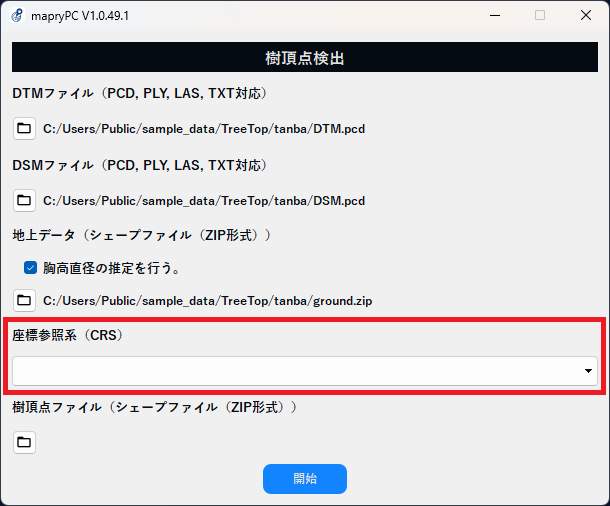
- Please enter the file (.zip) to save the tree apex detection results.
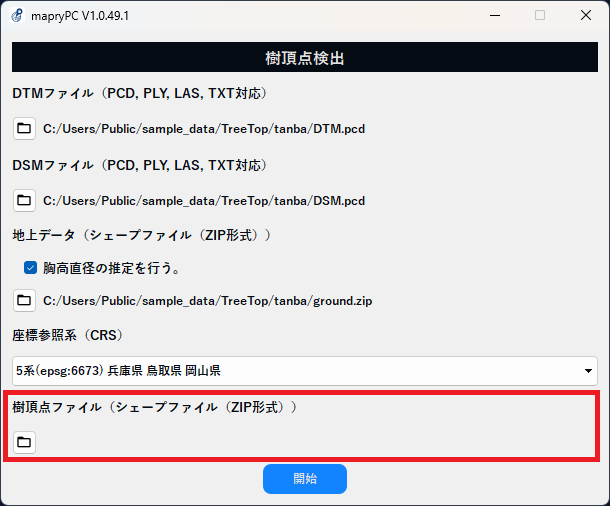
- After entering each item, click the "Start" button to start the tree apex detection process.
*Selecting the DTM file and DSM file and inputting the tree apex file are required fields.
The selection of ground data and coordinate reference system is arbitrary, so detection is possible even if the fields are left blank.
4.6. Contour lines 
Create contour line vector data.
Using DTM, calculate line data at regular intervals based on the set height, and output it as a shape file (.shp).
- Click the contour line icon from the toolbar .

- Select the DTM point cloud file (.pcd, .ply, .las, .txt).
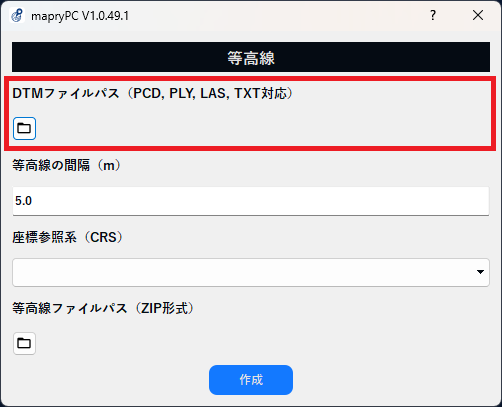
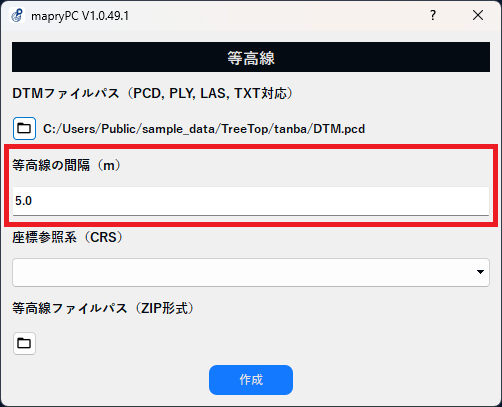
- Please enter the contour spacing. Values can be entered in 0.1m increments.
- Select the reference coordinate system (CRS).
The coordinate system can be selected from the Japanese Geodetic System 2011 system 1 (epsg:6669) to system 19 (epsg:6687).
If you do not know the coordinate system, leave it blank and proceed to the next item.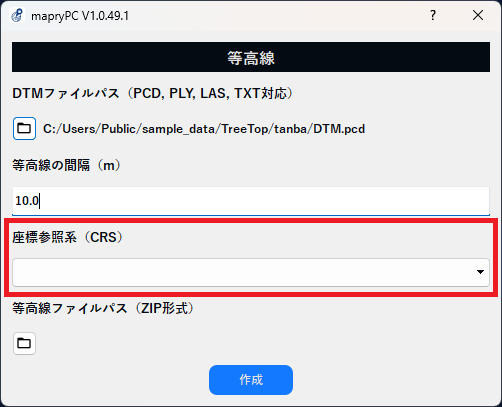
- Please enter the file (.zip) to save the contour results.
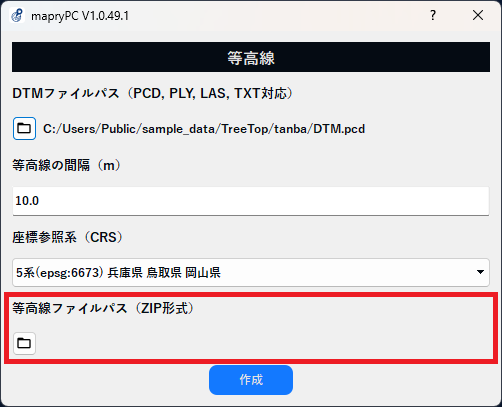
- After entering each item, create a contour line by clicking the "Create" button.
*The selection of the coordinate reference system is optional, so you can create contour lines even if you leave it blank.
4.7. Orthorectification 
This is a function that creates ortho images from multiple aerial photos.
- Click the orthorectification icon from the toolbar.

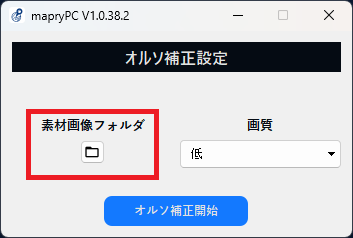
- Please select the folder where the aerial photos are saved from the settings screen.
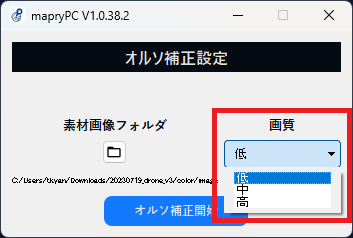
- Please select the image quality from the settings screen. The default is "low".
- Click on the start orthorectification button.
Estimated processing time is 10 to 30 minutes for 100 images, and 1 to 3 hours for 500 images.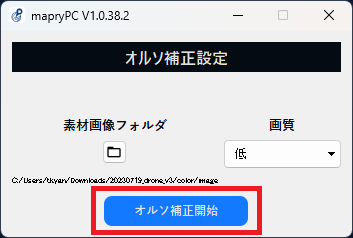
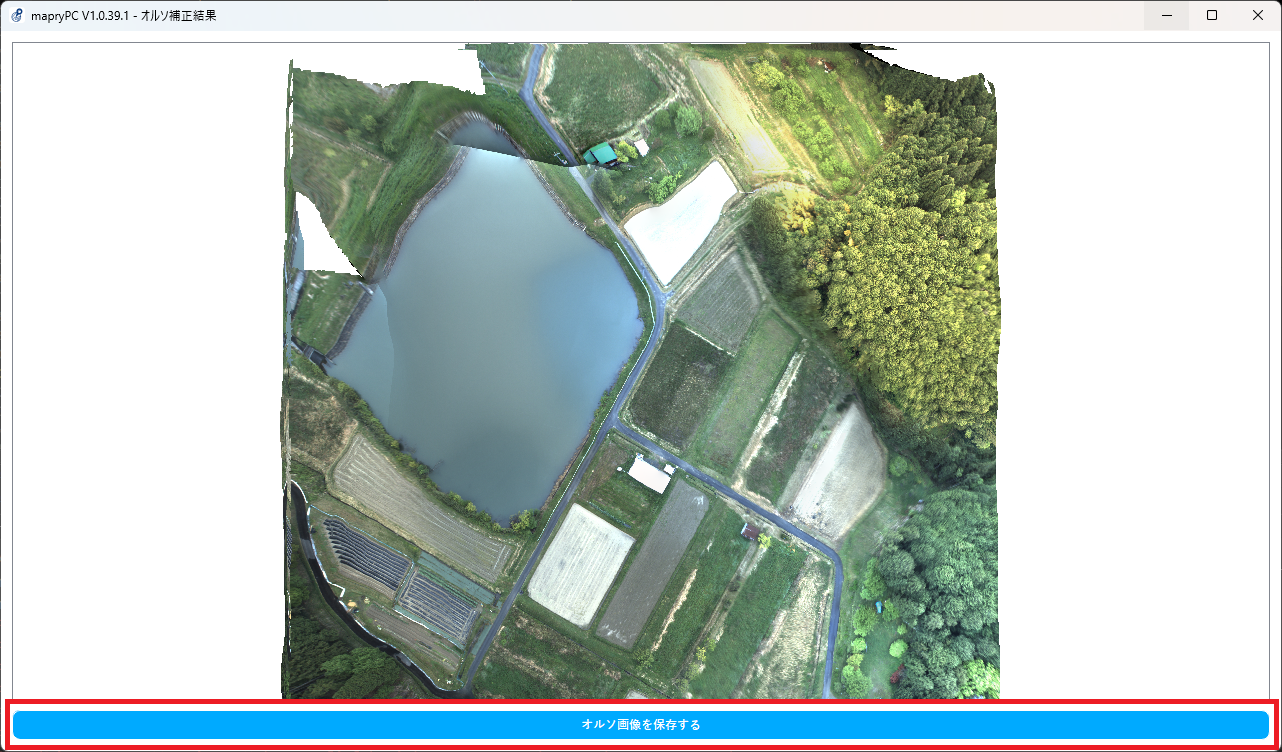
- Once the processing is complete, the ortho image will be displayed as the result.
You can save an ortho image in TIFF format (.tif) using the "Save ortho image" button.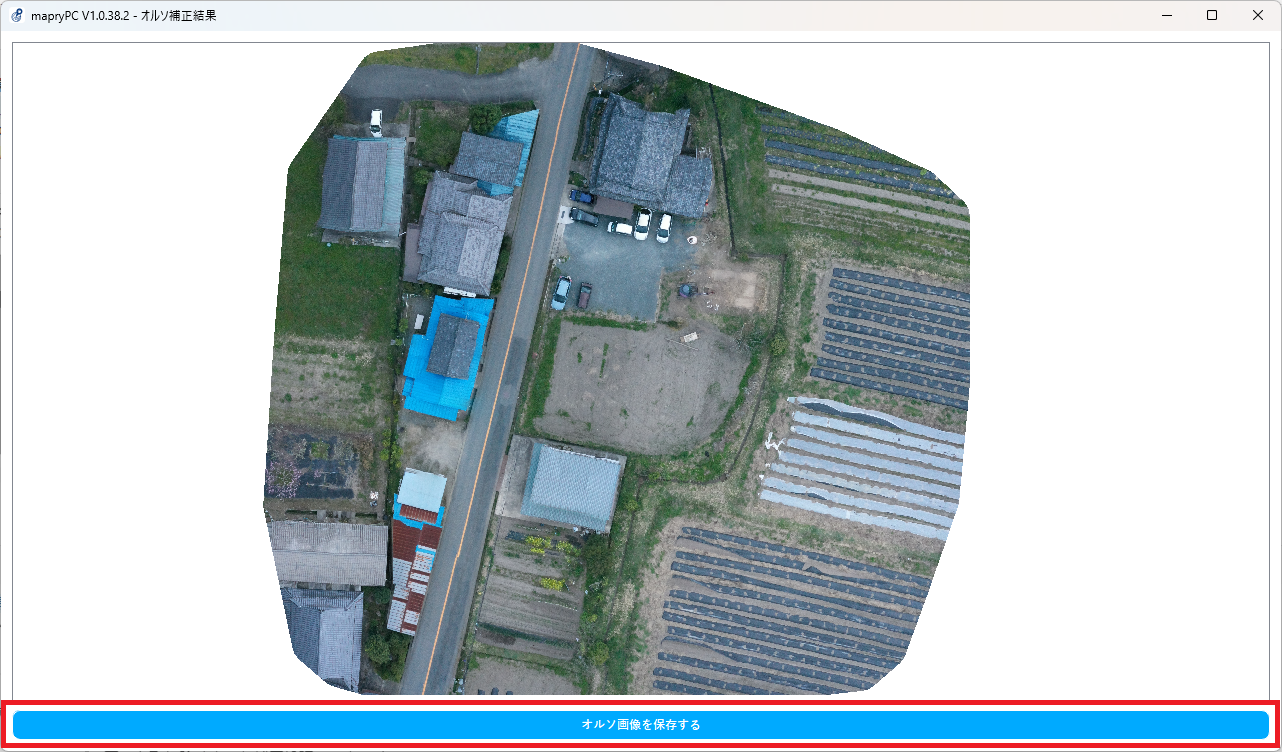
〇Notes
- An error may occur if the overlap rate is low or the image is blurred.
- It may also fail in environments that do not meet the recommended specifications.
4.8. DTM creation 
Create a DTM from the imported point cloud.
1. Select the point cloud to use from the layer.
2.Click on the DTM icon.
3. Click the OK button in the "Right-click twice to select the area to detect the ground surface" dialog.
4.Right-click to select two points, and the selected range with those two points as vertices will turn red.
- To decide the processing range, press the start button at the top left of the viewer.
- If you want to select the processing range again, press the back button at the top left of the viewer.
- To end DTM creation, press the exit button at the top left of the viewer. 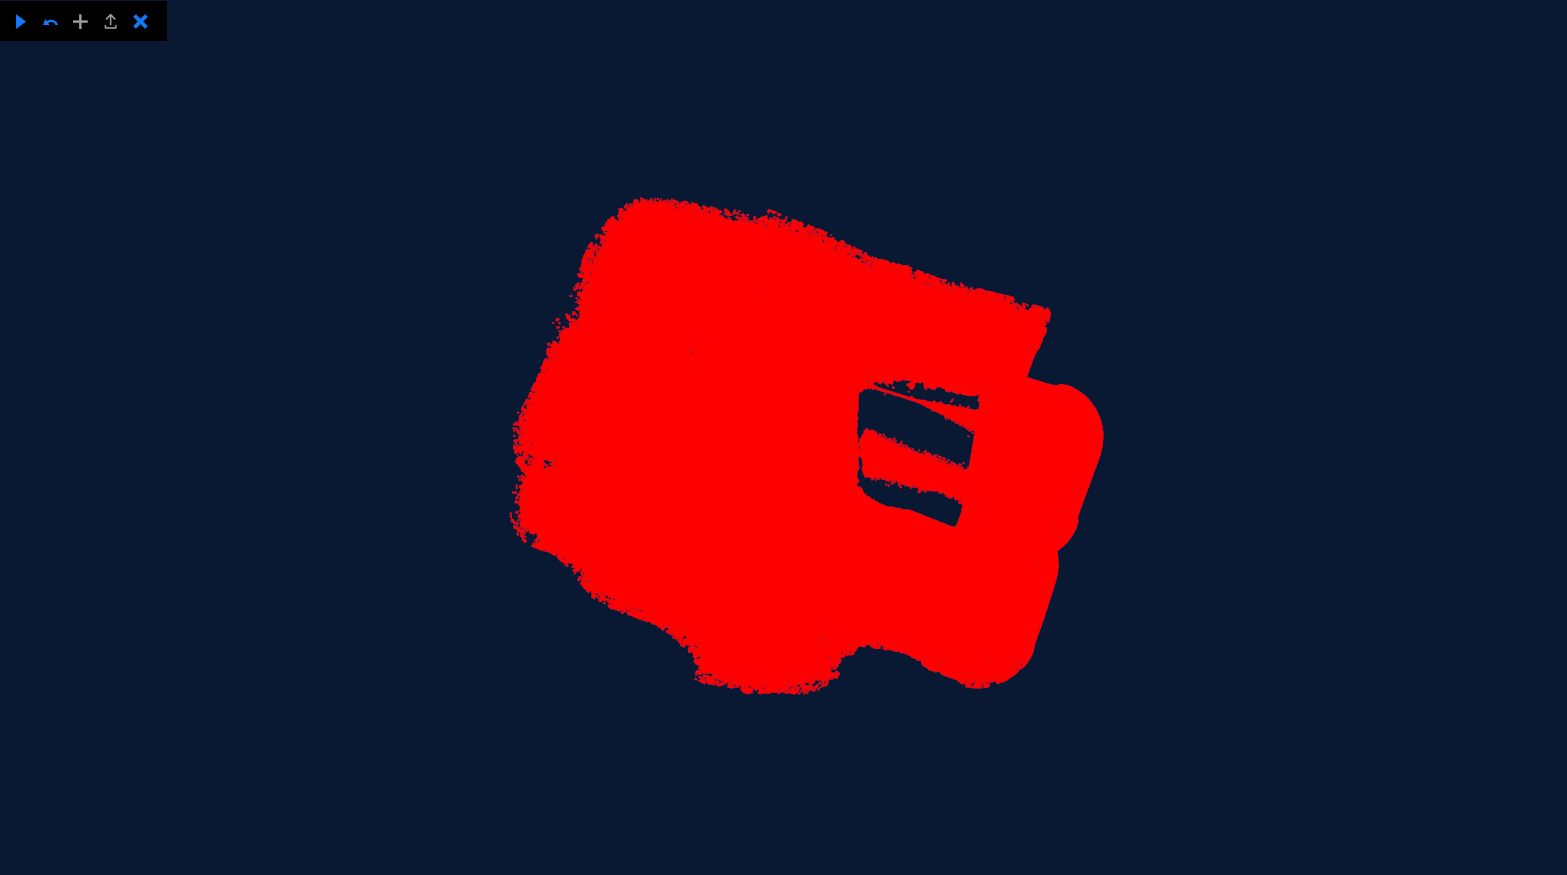
5. After pressing the start button, the DTM mesh level settings will be displayed. ① Mode selection (ground, drone) ② Mesh (0.25m, 0.5m, 1.0m)
Set ① and ② and press the DTM creation start button. 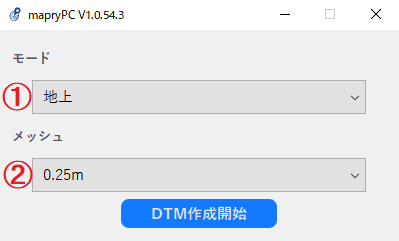
6. After DTM creation is complete, the DTM will be added to the same layer hierarchy. 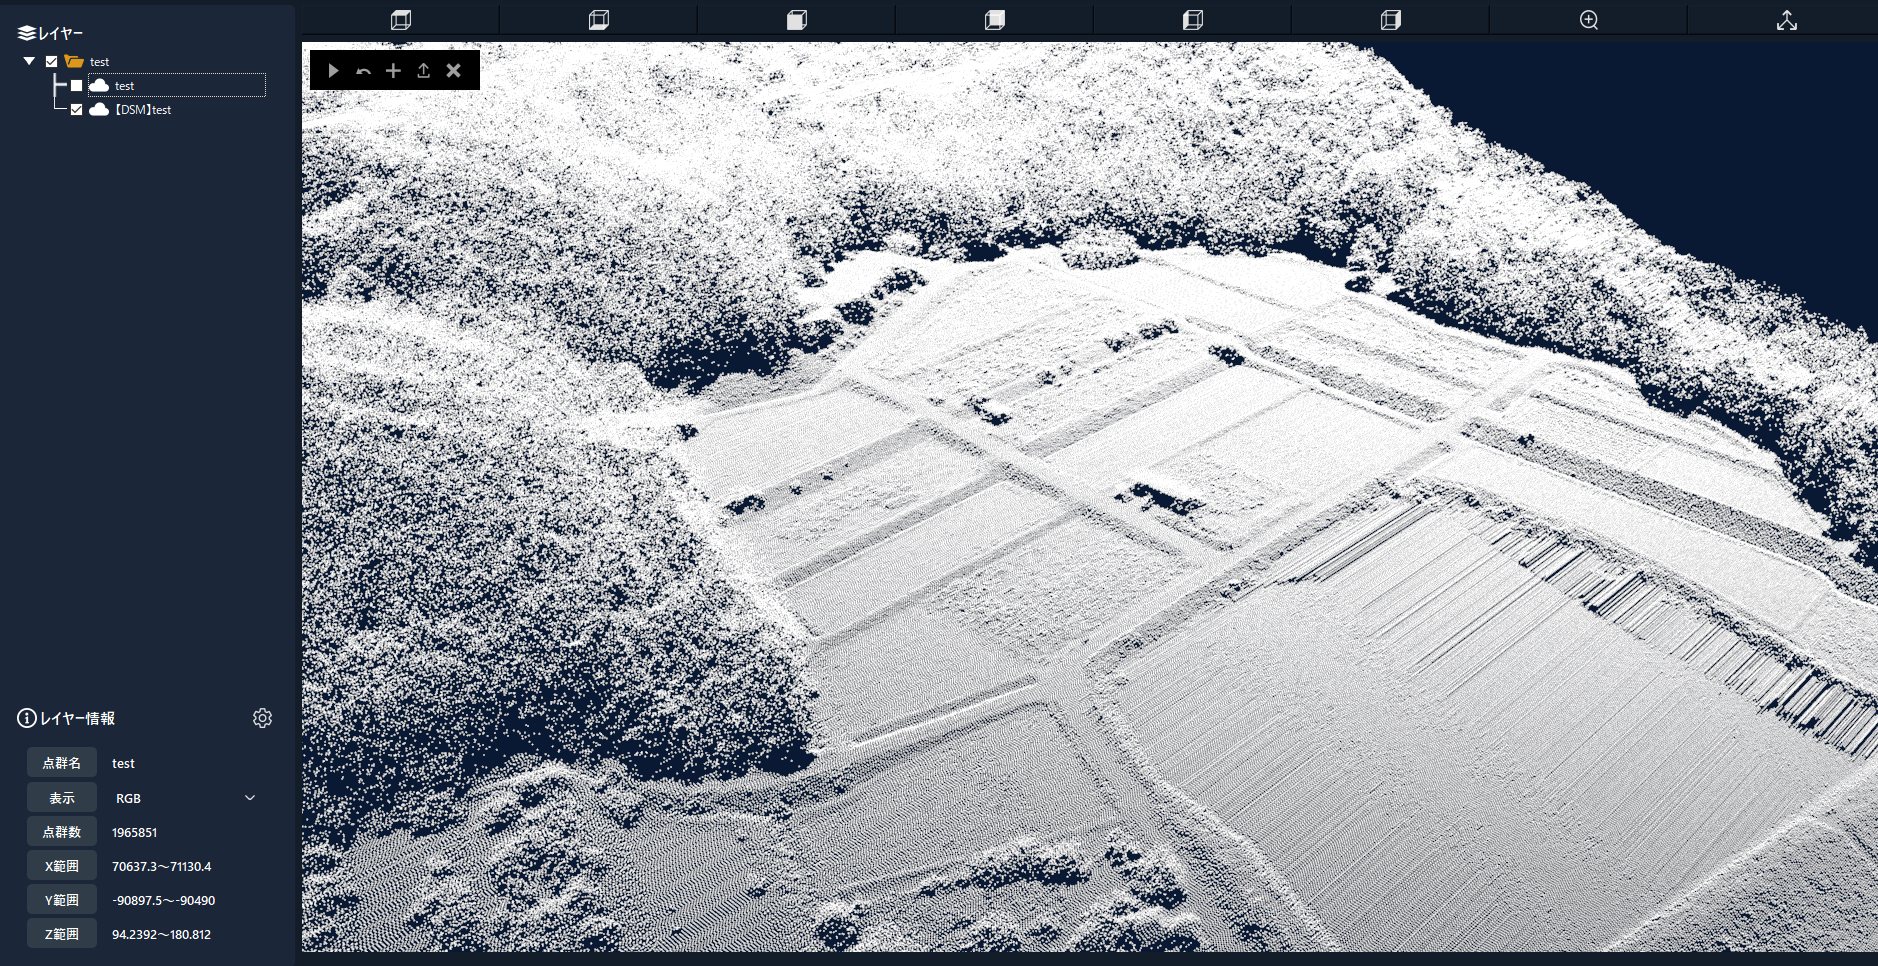
*Note: DTM creation may take some time depending on the size of the point cloud file used.
- The created DTM will be interpolated to be a rectangle. If the selected area is not a square, some of the edges may be output in DTM that differs from the actual terrain.
・There is no reflection intensity in the created DTM.
4.9. DSM creation 
Create a DSM from the imported point cloud.
1. Select the point cloud to use from the layer.
2.Click on the DSM icon.
3. Click the OK button in the "Right-click twice and select the range for creating the DSM" dialog.
4.Right-click to select two points, and the selected range with those two points as vertices will turn red.
- To decide the processing range, press the start button at the top left of the viewer.
- If you want to select the processing range again, press the back button at the top left of the viewer.
- To finish creating the DSM, press the exit button on the top left of the viewer. 
5. After pressing the start button, the DTM mesh level settings will be displayed.
Select the DTM mesh level to be created at the DSM mesh level from 0.25m, 0.5m, or 1.0m and press the DSM creation start button. 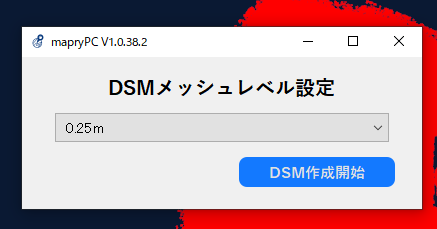
6.After DSM creation is complete, the DSM will be added to the same layer hierarchy. 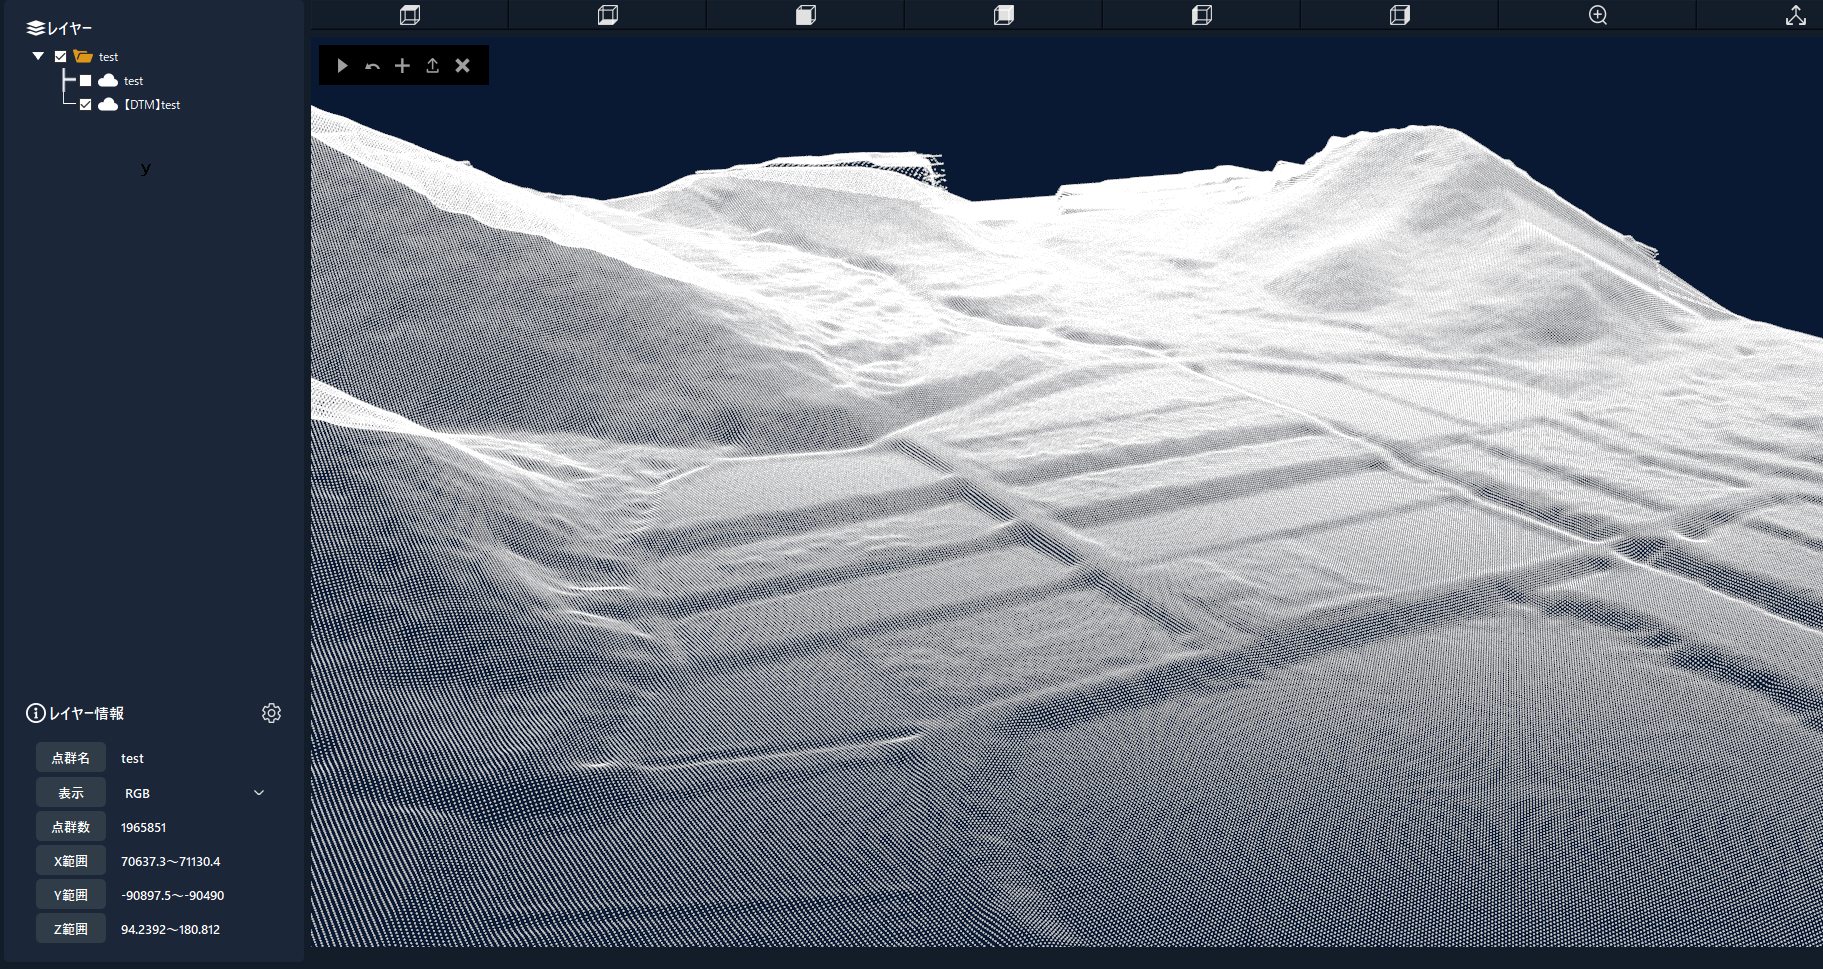
*Note: DSM creation may take some time depending on the size of the point cloud file used.
- There is no reflection intensity in the created DSM.
4.10. OBJ creation 
※in preparation.
4.11. TIFF resizing 
※in preparation.
4.12 CAD functions
This is a CAD function that uses data acquired with LA01 (fixed coloring).
Detects edges from captured images and creates CAD data with 3D coordinates of point clouds.
- Select one point cloud to use from the layer .

- Click the marker import icon from the toolbar . Next, click on "CAD Function".

- The CAD function screen will be displayed in a new window.
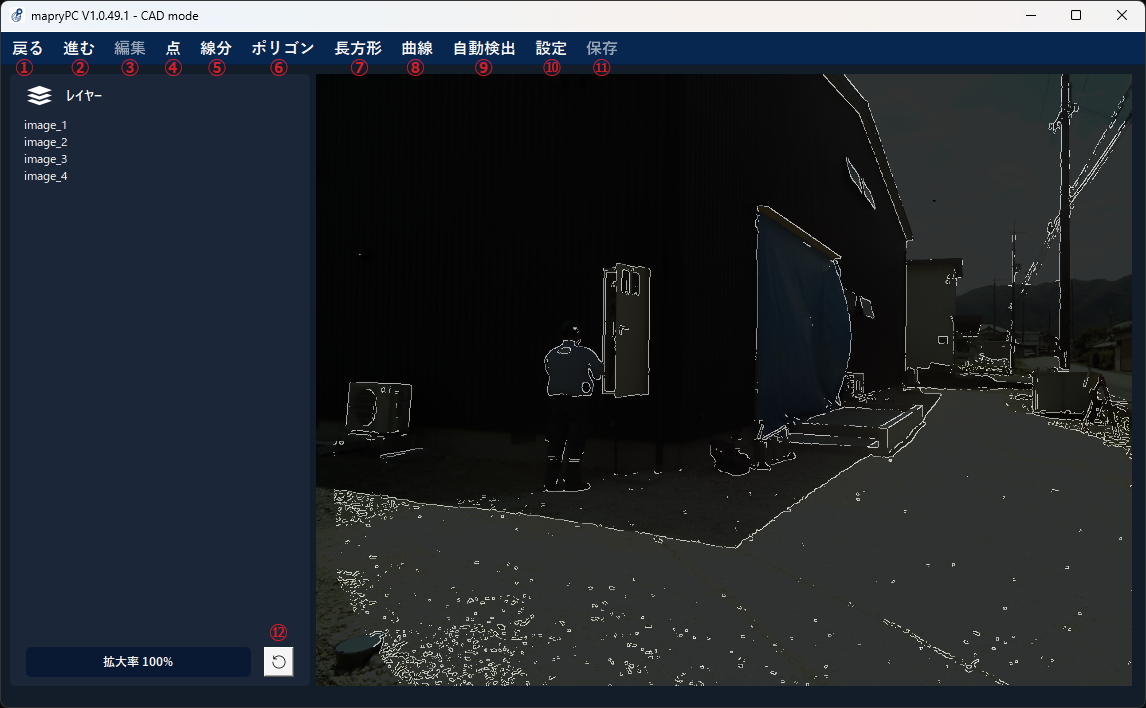
- Basic operations Left-click to set the vertices of each shape.
You can move the image by holding down the left click and moving the mouse.
Right-click to confirm drawing of shapes with multiple vertices, such as lines, polygons, and curves.
You can use the mouse wheel to enlarge or reduce the image.
4.12.1 Back
Cancels and undoes the previous action.
4.12.2 Forward
Redoes the most recently undone operation.
4.12.3 Edit
Edit the drawn shape.
- basic operation
-
Select the range by left-clicking.
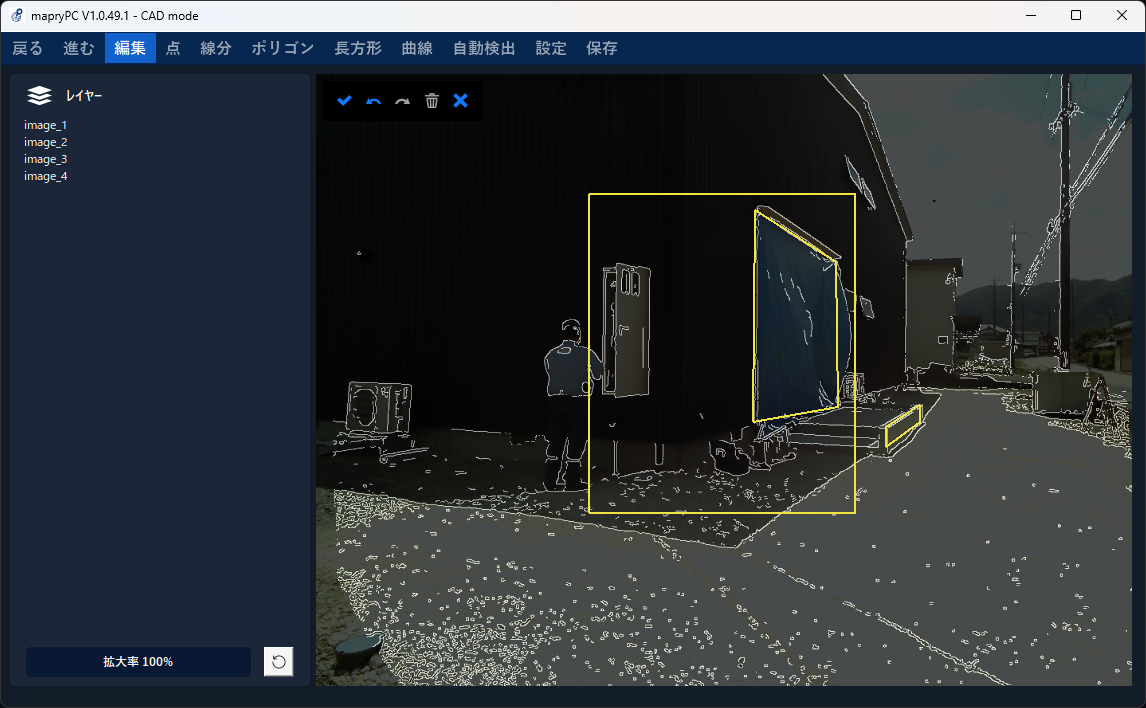
-
If there are vertices of the shape within the range, the editable shape turns red and the vertices are displayed.
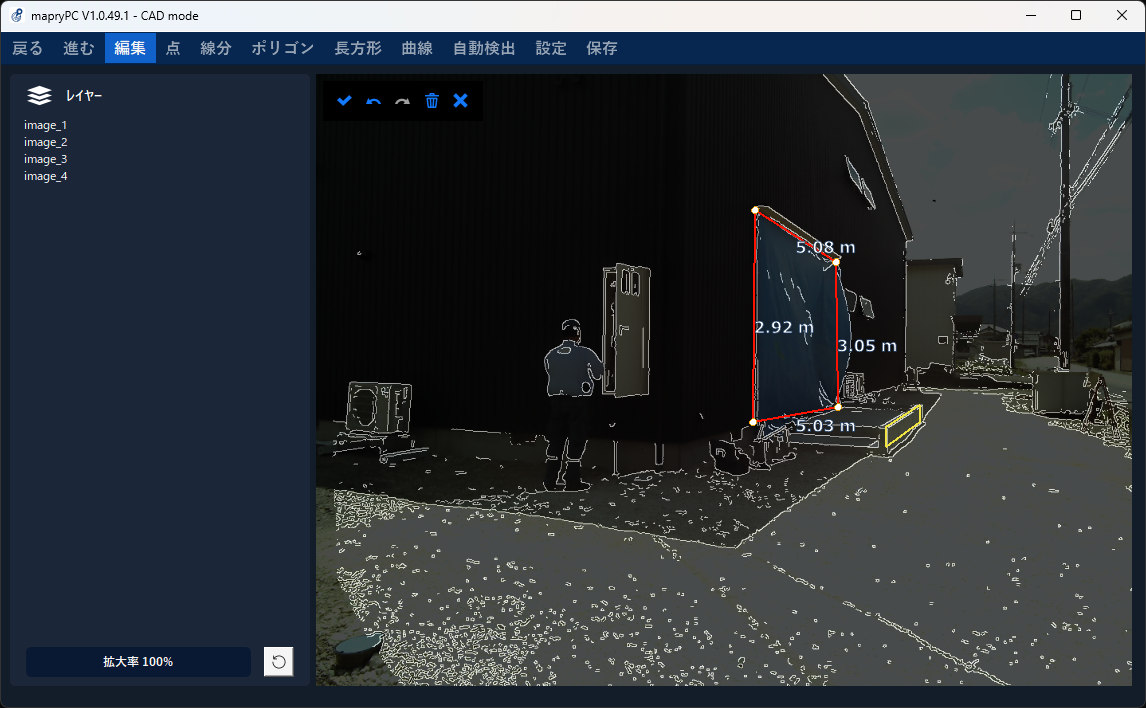
-
You can move the vertices of the shape by right-clicking.
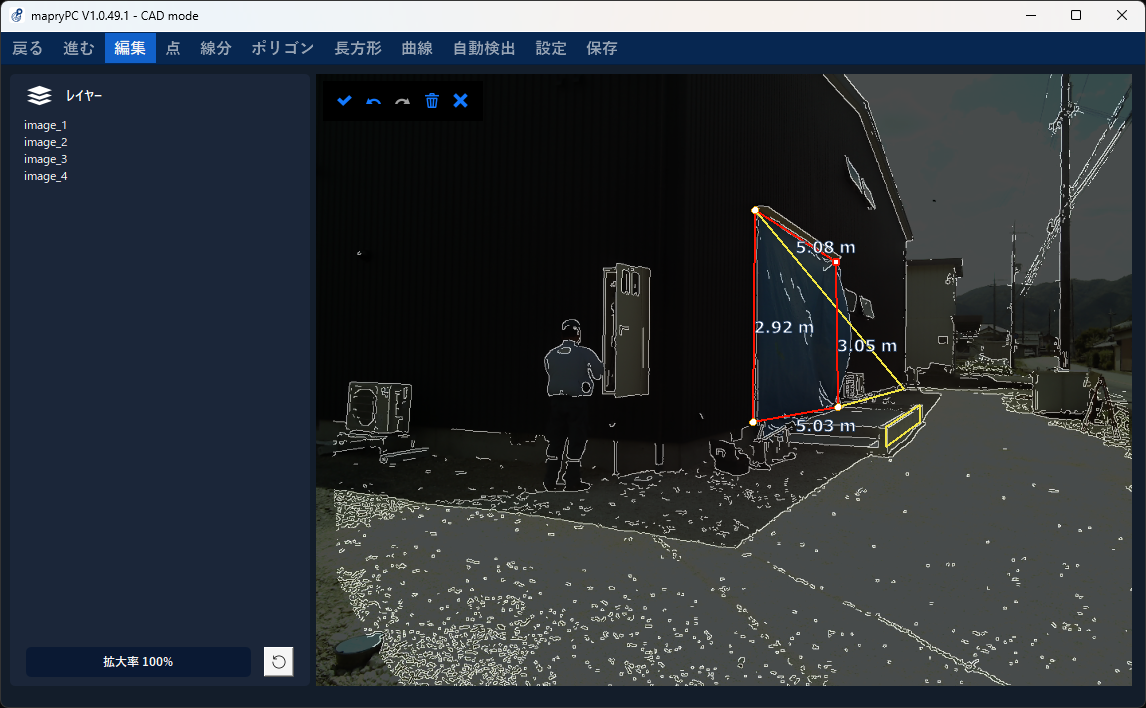
-
- Control panel
- Decide: Decide the editing result.
- Back: Undo and undo the last editing operation.
- Forward: Redoes the most recently undone operation.
- Delete: Delete the selected shape.
- Abort: Discard the editing results and cancel the editing operation.

4.12.4 points
Creates a point at the location you right-click.
4.12.5 Line segment
Creates a line segment with the vertex at the right-clicked position. Click twice or more to draw a line segment connecting each vertex.
4.12.6 Polygon
Creates a polygon with vertices at the right-clicked position. Click three or more times to draw a polygon connecting each vertex.
4.12.7 Rectangle
Creates a rectangle with vertices at the location where you right-click. Click twice or more to draw a rectangle.
4.12.8 Curve
Creates a curve (Bezier curve) with the right-clicked position as the control point. Click three or more times to draw a Bezier curve according to the control points.
4.12.9 Automatic detection
Automatically detect and create line segments from edge images. 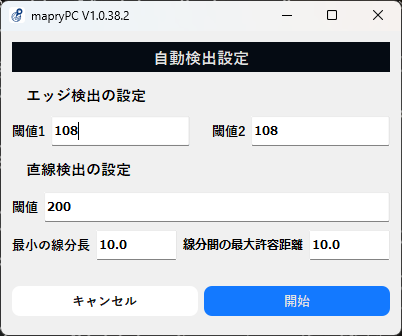
- Edge detection settings Threshold 1: Based on the edge detected by the value of Threshold 2, if the difference in brightness between pixels around the edge is greater than Threshold 1, it will be detected as an edge.
Threshold 2: If the difference in brightness between adjacent pixels is greater than threshold 2, it is detected as an edge. - Setting threshold for straight line detection: If the difference in brightness between adjacent pixels is greater than the threshold, it will be detected as a line segment.
Minimum line segment length: Among the detected line segments, line segments shorter than the specified value will be excluded.
Maximum allowable distance between line segments: If the distance between adjacent detected line segments is less than the specified value, they will be detected as a single straight line.
4.12.10 Settings
You can change the edge detection threshold and image transparency.
The Canny method is used for edge detection. 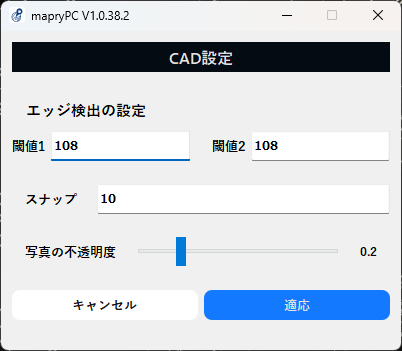
- Edge detection settings Threshold 1: Based on the edge detected by the value of Threshold 2, if the difference in brightness between pixels around the edge is greater than Threshold 1, it will be detected as an edge.
Threshold 2: If the difference in brightness between adjacent pixels is greater than threshold 2, it is detected as an edge. - Snap: You can specify the snap level.
- Photo Opacity: You can set the opacity of the background image.
4.12.11 Save
Save the drawn shape to a DXF file (.dxf).
After entering each item, click the "Save" button to save the file. 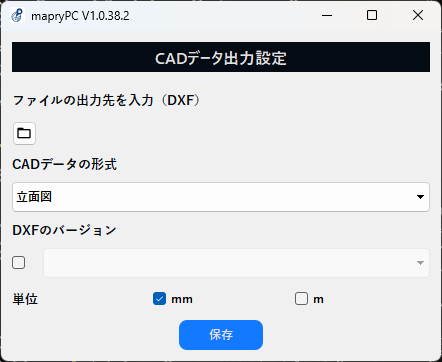
- Enter the file save destination (DXF): Please set the file path to save.
- CAD data format: Select "Elevation" or "Plan".
- DXF version: You can specify the DXF version. When specifying, please select from "R12/R2000/R2004/R2007/R2000/R2013/R2018".
4.12.12 Reset magnification
Return the magnification to 1.
The position of the image will also be returned to its initial state.
4.13 LiDAR-Camera Calibration
This function performs LiDAR and camera calibration.
Outputs the internal and external parameters after correction.
- Click the marker import icon from the toolbar . Then click "Camera Calibration".

- Select the LA01 data folder acquired in fixed coloring mode.
The "Select Folder" button starts the import process.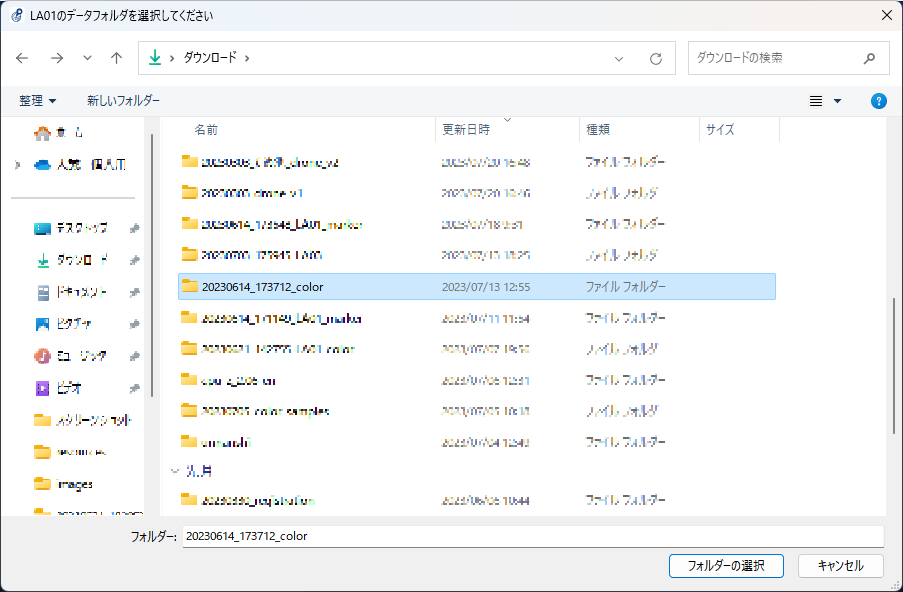
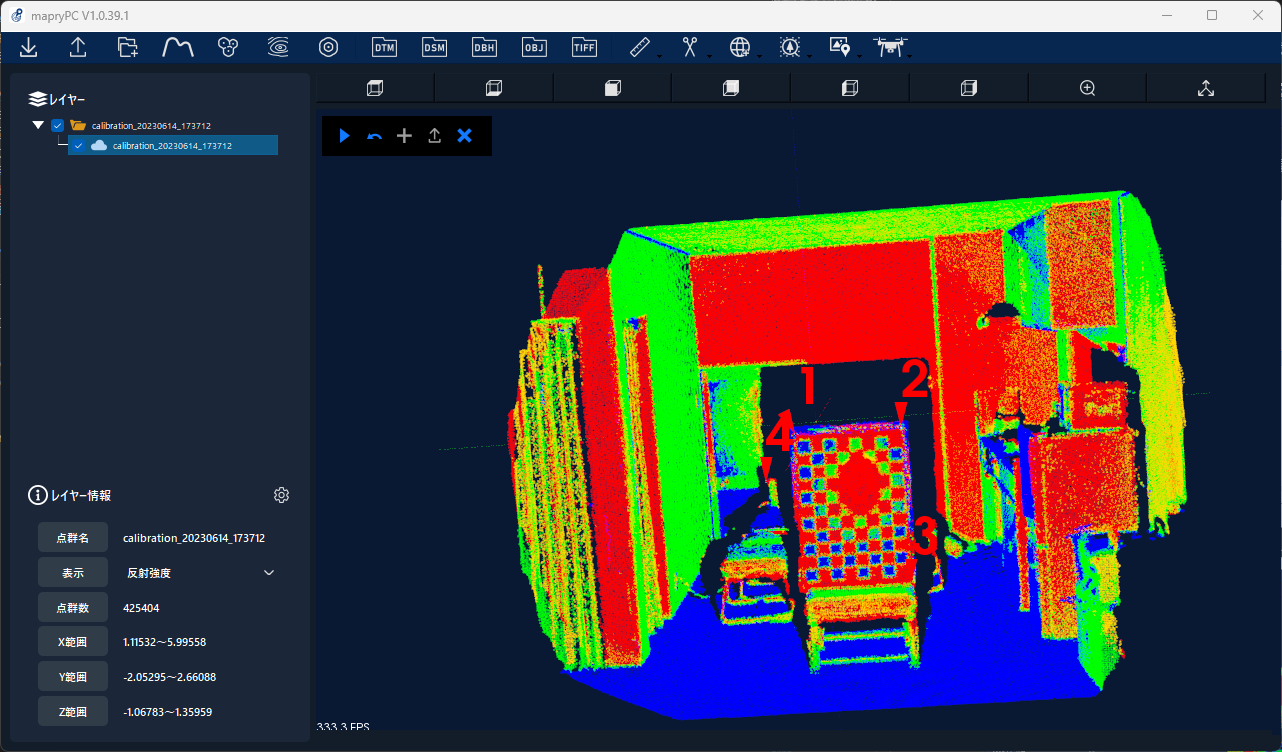
- The point cloud and image are displayed separately. Select four feature points by right-clicking.
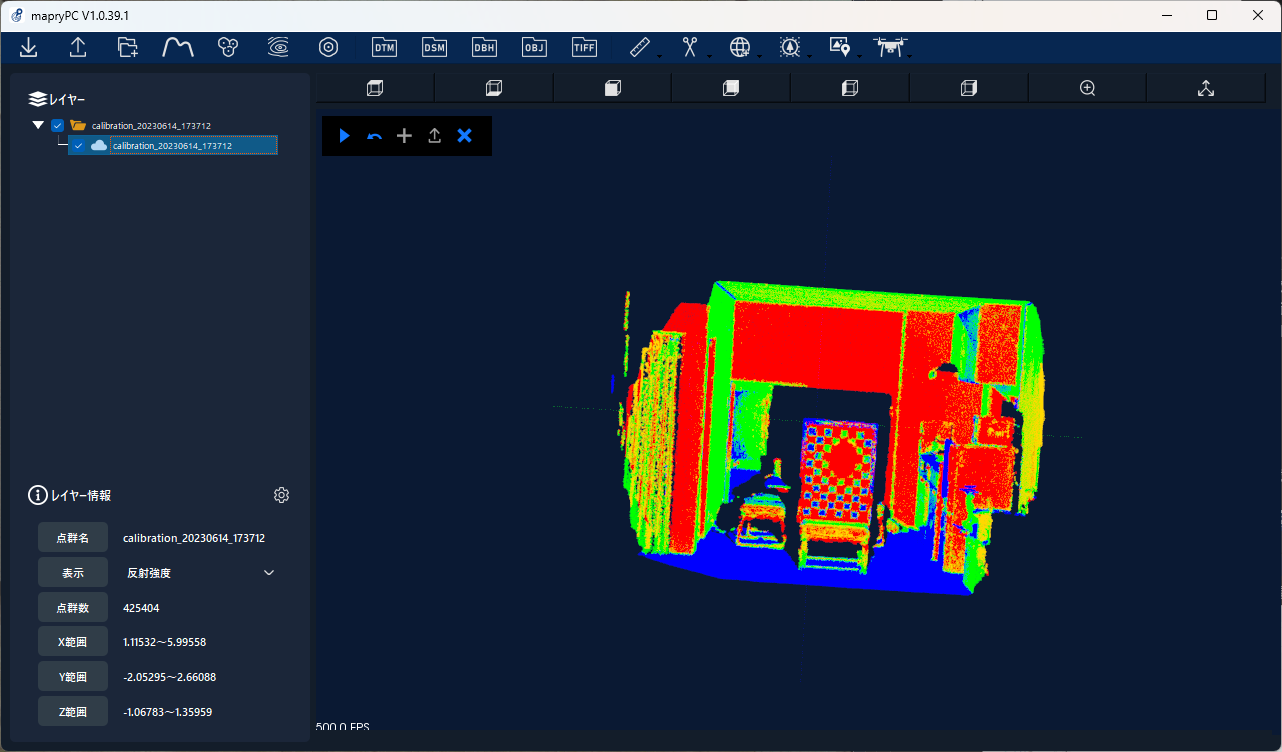
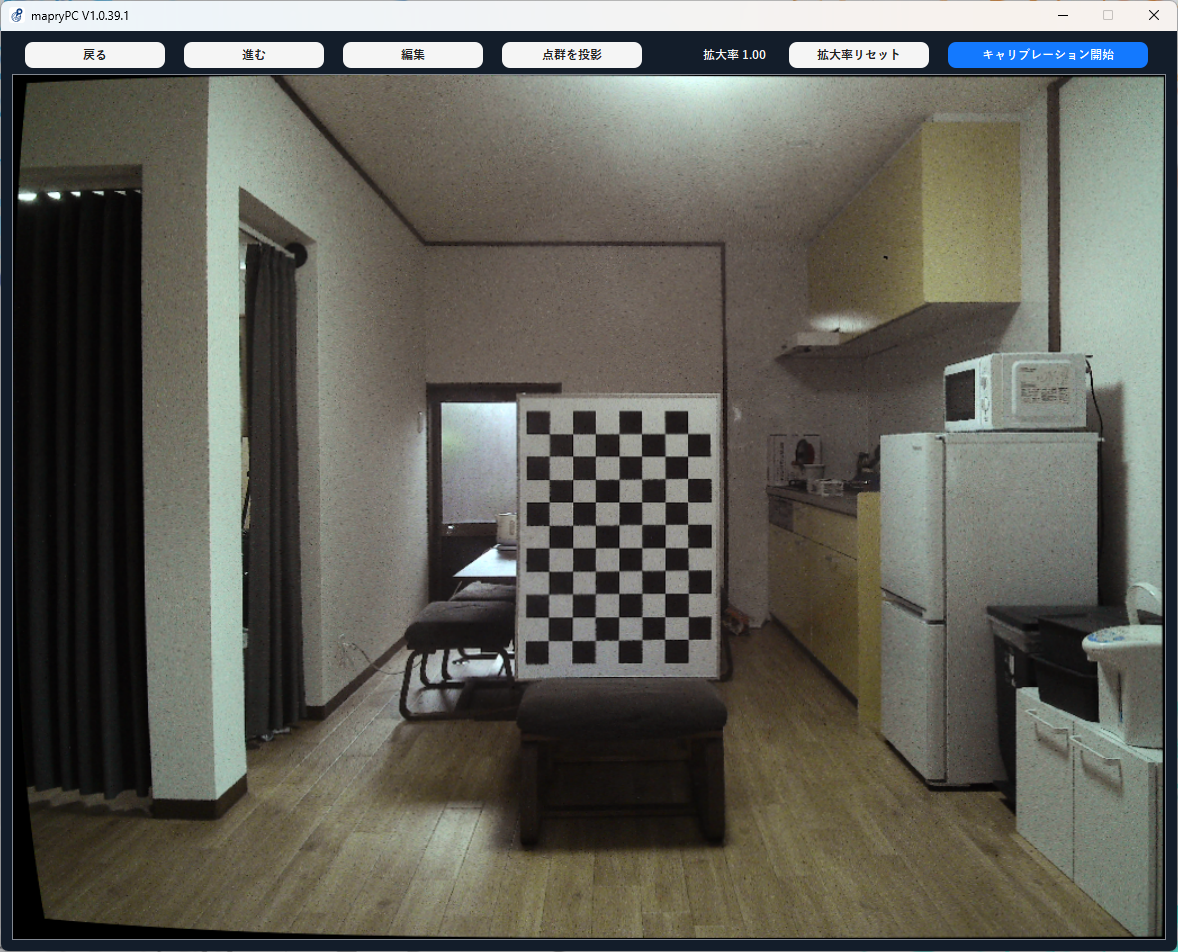
- After selecting the feature points, click the "Start Calibration" button to start the process.
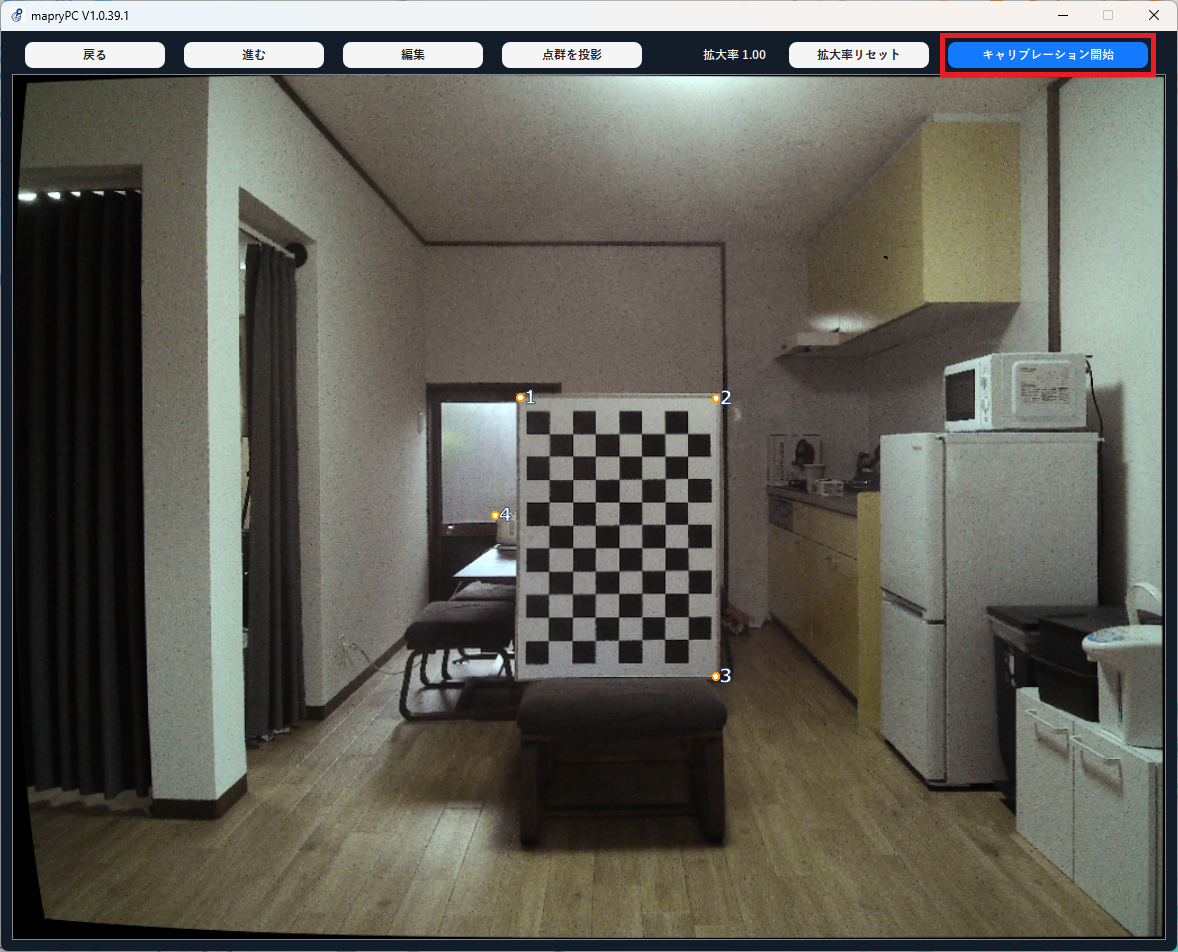
- After the calibration process, save the corrected camera parameters in the imported data folder.
Additionally, the point cloud is colored using the corrected camera parameters and the result is displayed in the viewer.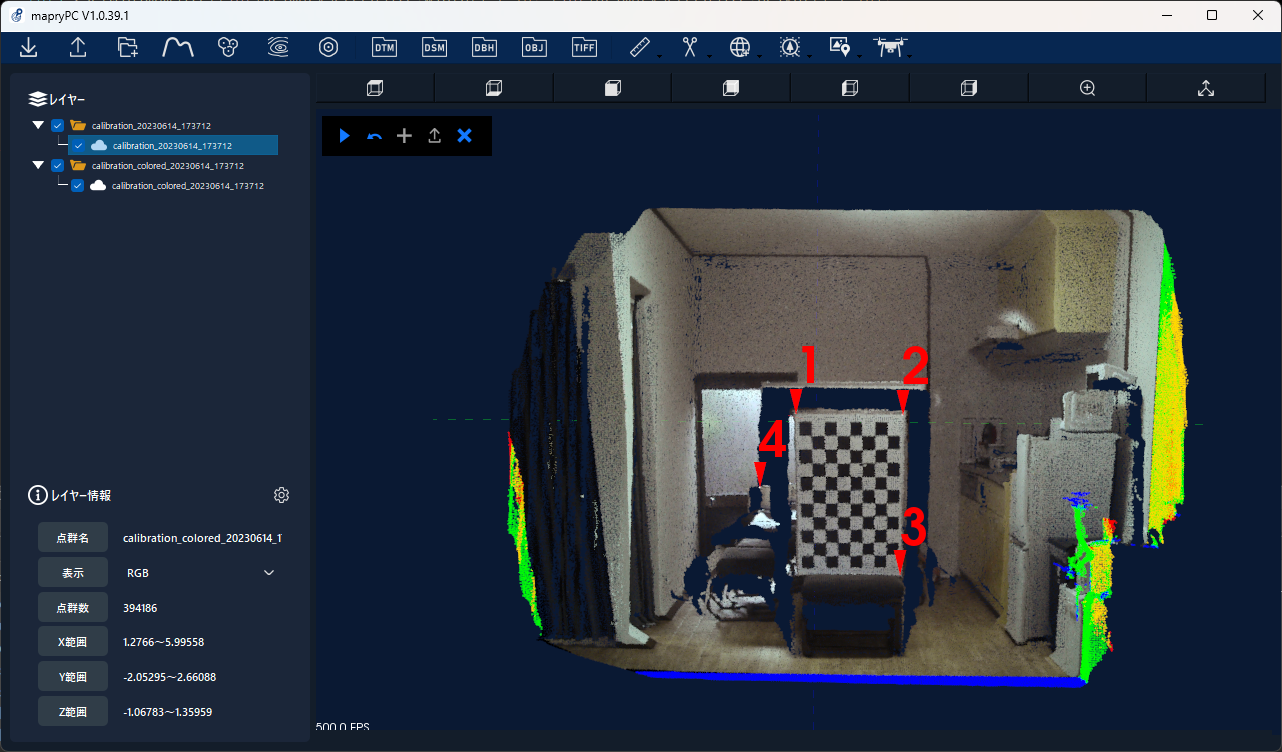
If there is a discrepancy in the coloring results, select the feature points again and perform calibration again.
- Button description

① Back: Cancels the previous operation and restores it.
② Forward: Redo the last canceled operation.
③Edit: You can move feature points later.
④ Project point cloud: Project the point cloud onto the image using camera parameters.
⑤ Magnification rate: Displays the current magnification rate.
⑥ Reset magnification rate: Return the magnification rate to 1. The position of the image will also be returned to its initial state.
4.14. Simple measurement 
Distance/area measurement and volume measurement can be performed.
4.14.1 Distance/area measurement
1.Press the simple measurement button and select “distance/area measurement”. 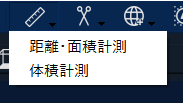
2.Click the OK button in the dialog box that says “Distance and area can be measured using Shift key + left click.”
3.When the simple measurement is ready for use, the icon shown below will be added to the upper left of the viewer. ![]()
[Various button explanations] ![]()
Delete the last clicked point. ![]()
If you select 3 or more points and click, it will become a polygon. ![]()
Add the measurement results to the layer. ![]()
Ends simple measurement.
4. Press Shift + Left Click to select two or more points, and the distance between the two points will be displayed. 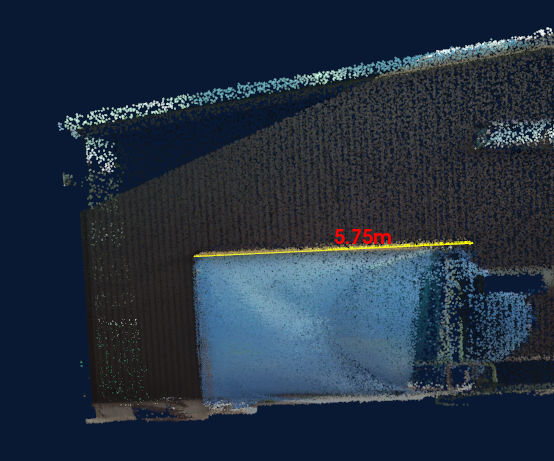
If you press the polygon button with 5.3 or more points selected, it will become a polygon and you can measure the area within the polygon. 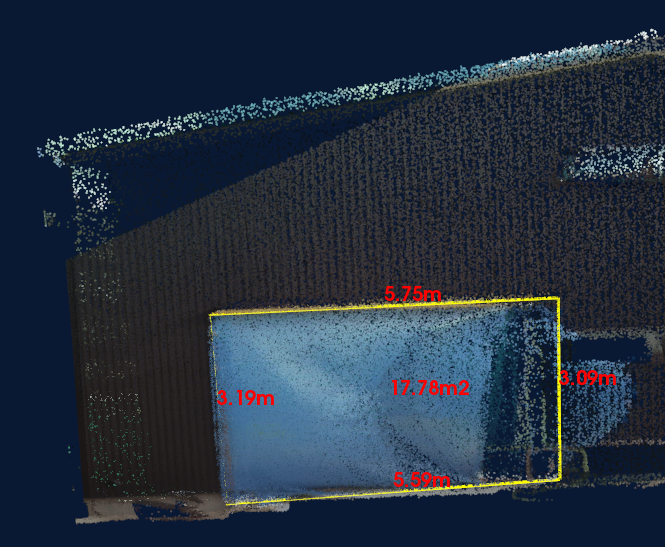
6.Press the + mark icon to add the measurement results to the layer. 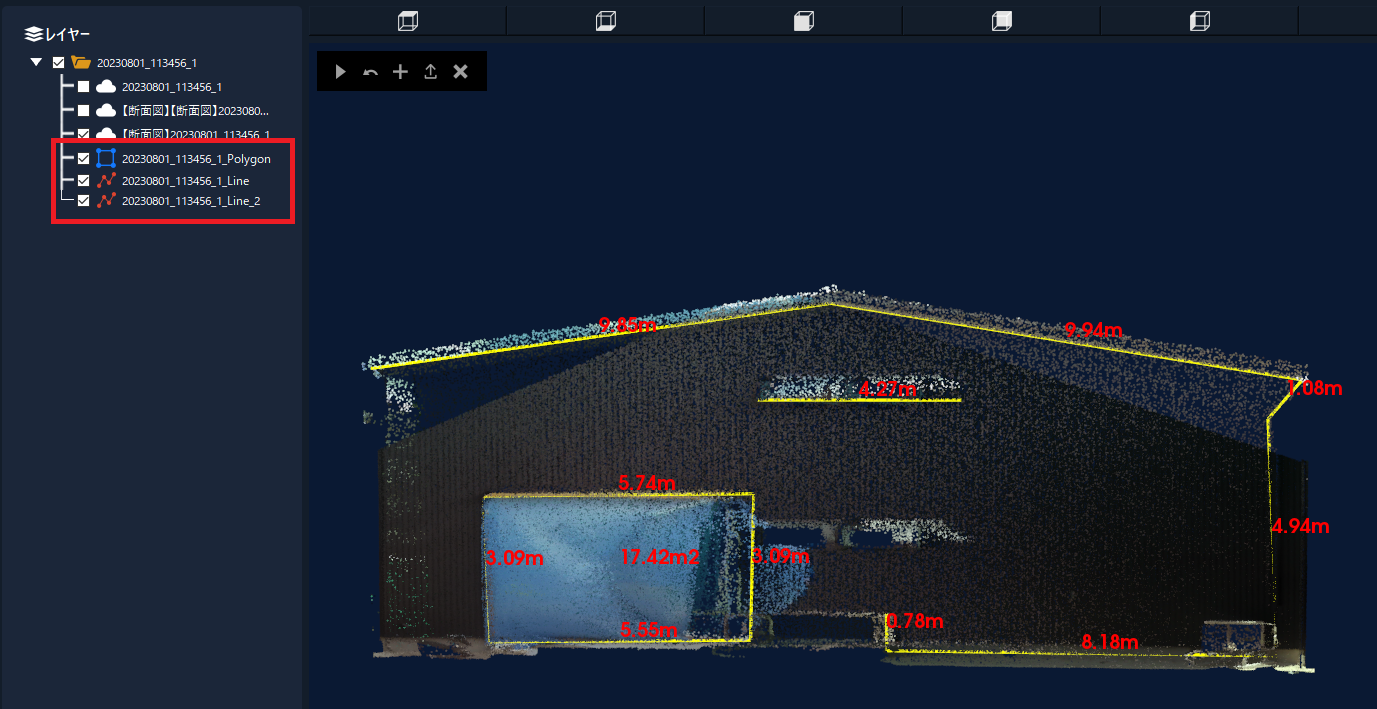
7.Measurement results can be output as a cross-sectional view or a plan view. Please check here for the output method.
4.14.2 Volume measurement
1.Press the simple measurement button and select "Volume measurement". 
2.Click the OK button in the dialog box that says “After selecting the range with Shift key + left click, you can measure the volume with the start button.”
3.When the simple measurement is ready for use, the icon shown below will be added to the upper left of the viewer. ![]()
[Various button explanations] ![]()
You can display or hide measurement results. ![]()
Start volume measurement. ![]()
Delete the last selected point. ![]()
Finish volume measurement.
4.Press Shift key + left click to place a blue sphere at the selected location. 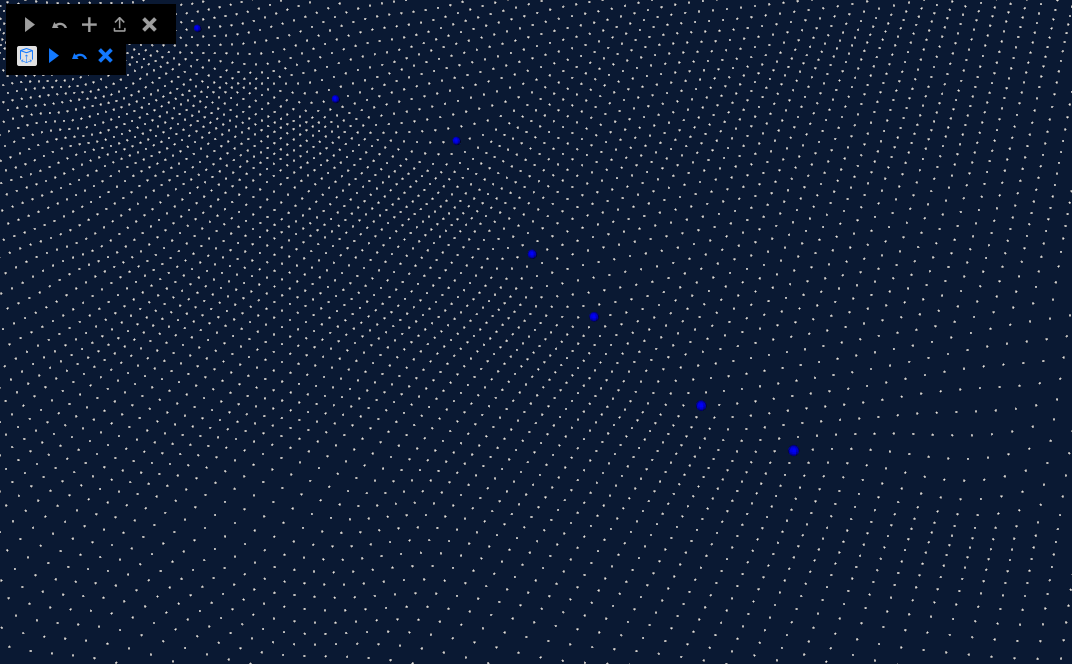
5.Press the start key on the top left to display the volume of the selected range. 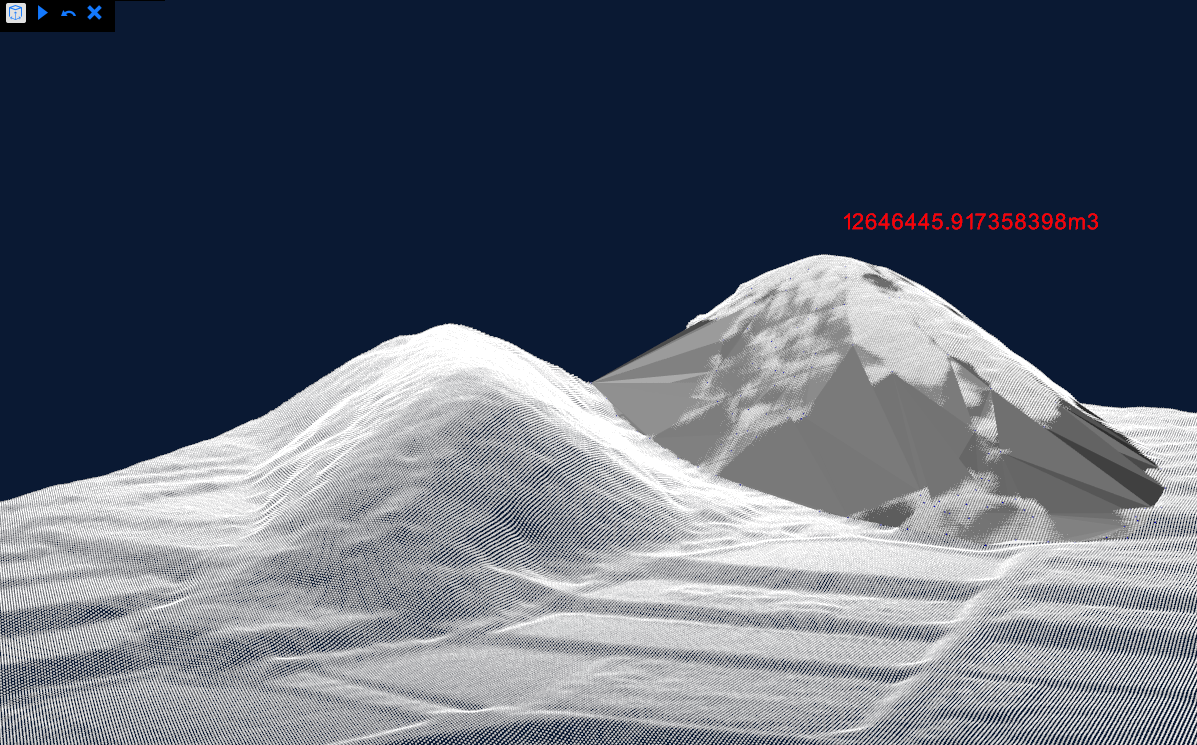
4.15. Point cloud cut 
Cuts the point cloud within the selected range.
4.15.1 Select the deletion range and cut the point cloud
1. Select the point cloud to use from the layer.
2.Click on the point cloud cut icon, select "Select deletion range", and select "Delete inside" or "Delete outside".
“Delete inside” → Delete the inside of the selected range.
“Delete outside” → Delete the outside of the selected range. 
3.Click the OK button on the "Right-click to select a range. The selected range will be deleted." dialog box.
4.Right-click and select three or more points you want to delete. The selected area will be surrounded by green and red lines.
*The viewpoint will be fixed while selecting the range. 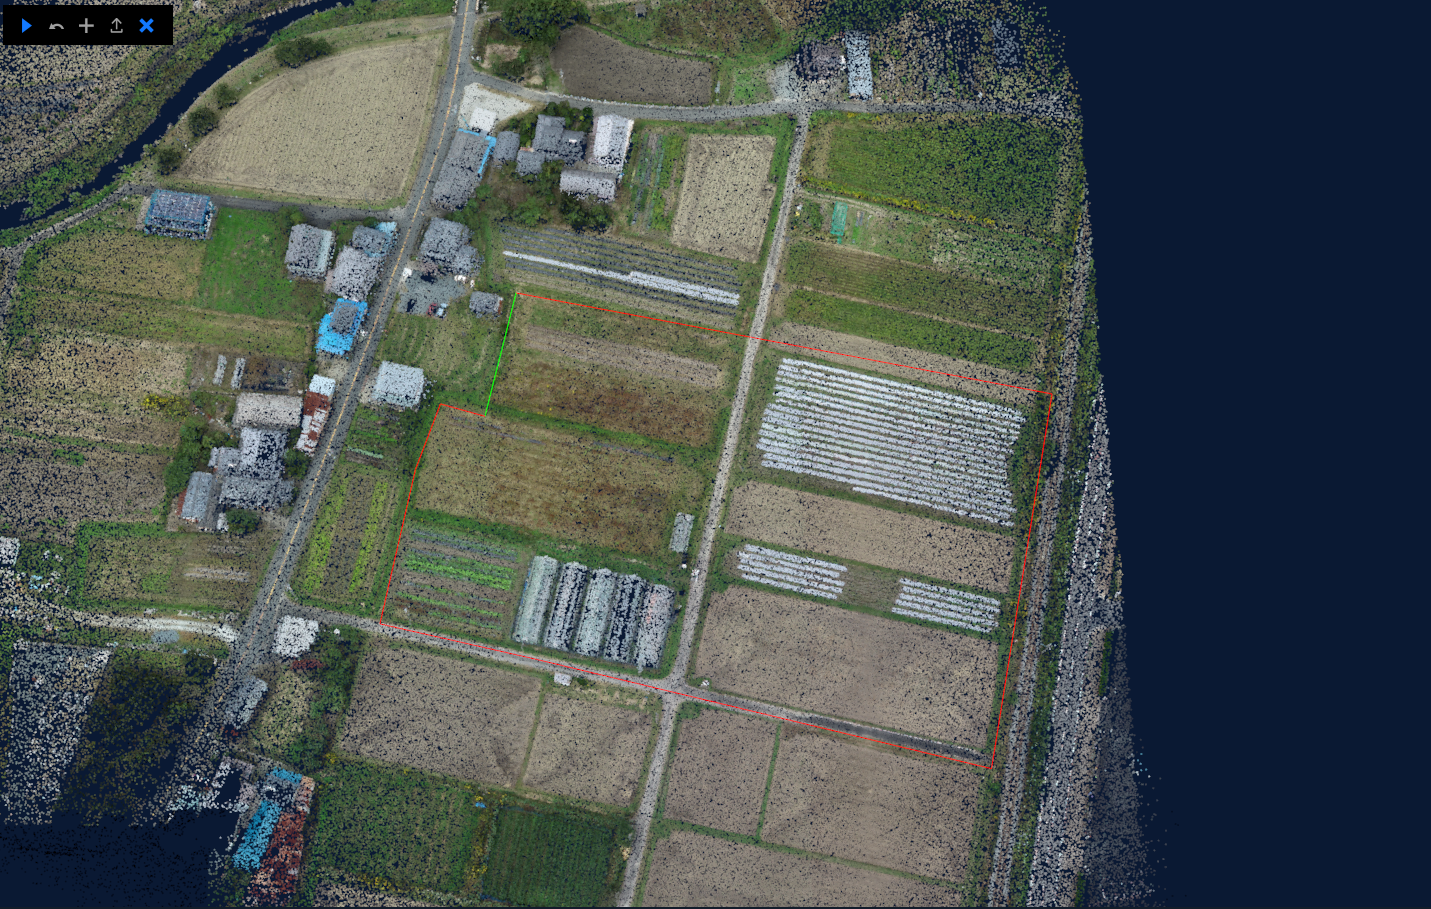
5. Press the start button on the top left to start processing and update to the cut point cloud. 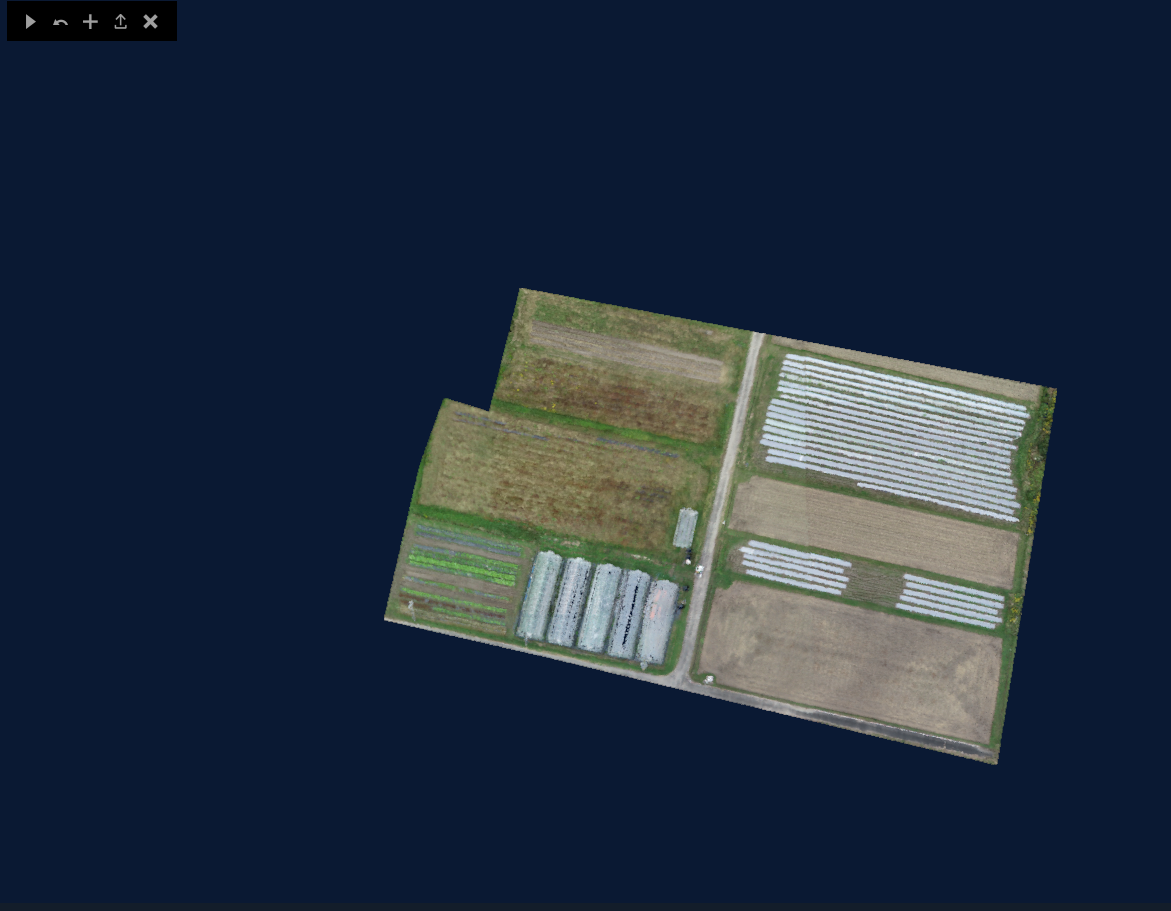
*Note: Depending on the size of the point cloud file used, it may take some time to cut the point cloud.
・The point cloud before cutting will not remain.
- If you want to select a processing range, please finish point cloud cut once, start point cloud cut again, and select the range.
4.15.2 Cut a point cloud using markers
Cuts the point cloud using polygons that connect the markers in the order they are acquired.
1. Select the point cloud to use from the layer.
2. Make sure the markers are imported.
3. Click the point cloud cut icon, select "Select deletion range", and select "Delete inside" or "Delete outside".
“Delete inside” → Delete the inside of the selected range.
“Delete outside” → Delete the outside of the selected range. 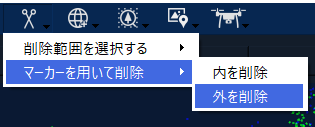
4. Processing will begin and the cut point cloud will be updated.
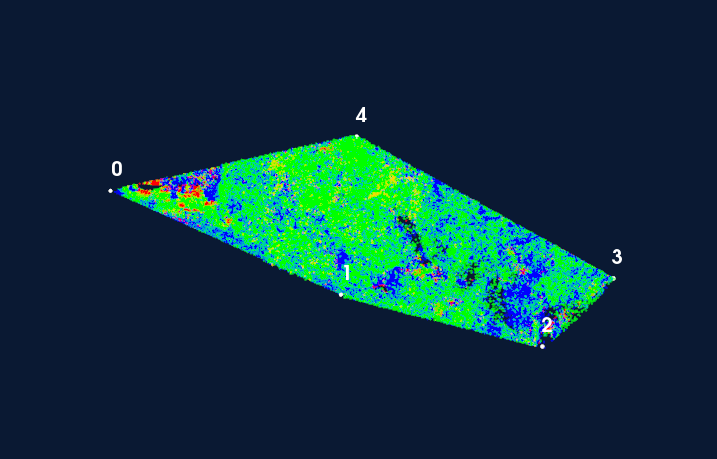
〇Notes - Cut the point cloud within the range that connects all markers in order from the current viewpoint.
- Depending on the size of the point cloud file used, it may take some time to cut the point cloud.
・The point cloud before cutting will not remain.
4.16. Coordinate transformation 
4.16.1 Translation
Translate the point cloud.
4.16.2.1 Click to select source coordinates
1. Select the point cloud to use from the layer.
2. Make sure the markers are imported.
3.Click on the coordinate transformation icon and select Translation → Transform using projected coordinate system → Click on the coordinates of the transformation source and select Select. . 
4. Click the OK button in the "Selecting points for coordinate transformation. Right-click to select one point to use for parallel translation." dialog.
5. Right-click on the viewer to select the point that will be the starting point for parallel movement. Once you have determined the point, press the start button at the top left of the viewer. 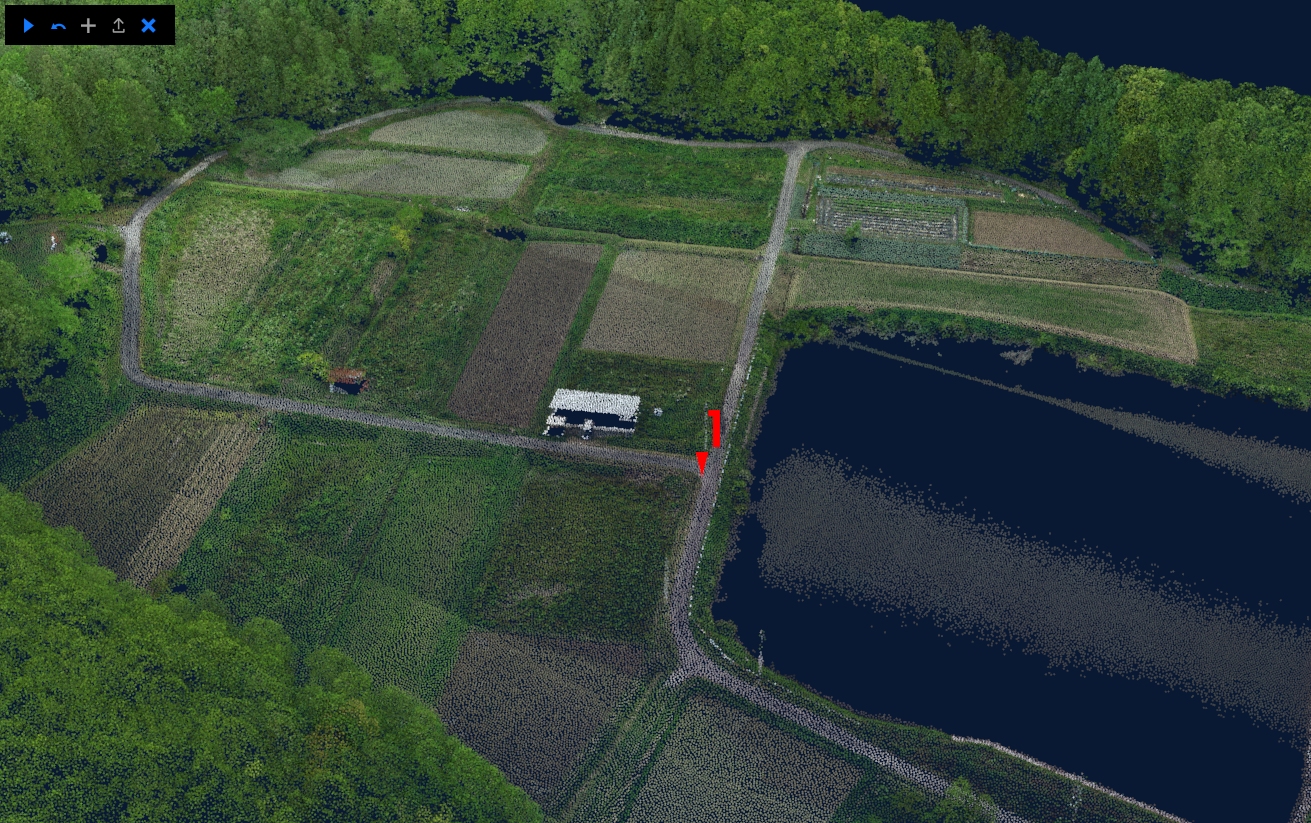
6. The coordinate conversion dialog will appear. Enter the destination coordinates and press the "Convert point cloud" button. 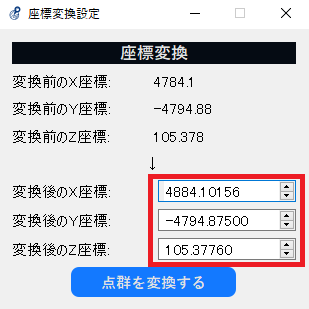
7. After loading, the transformed point cloud will be added. 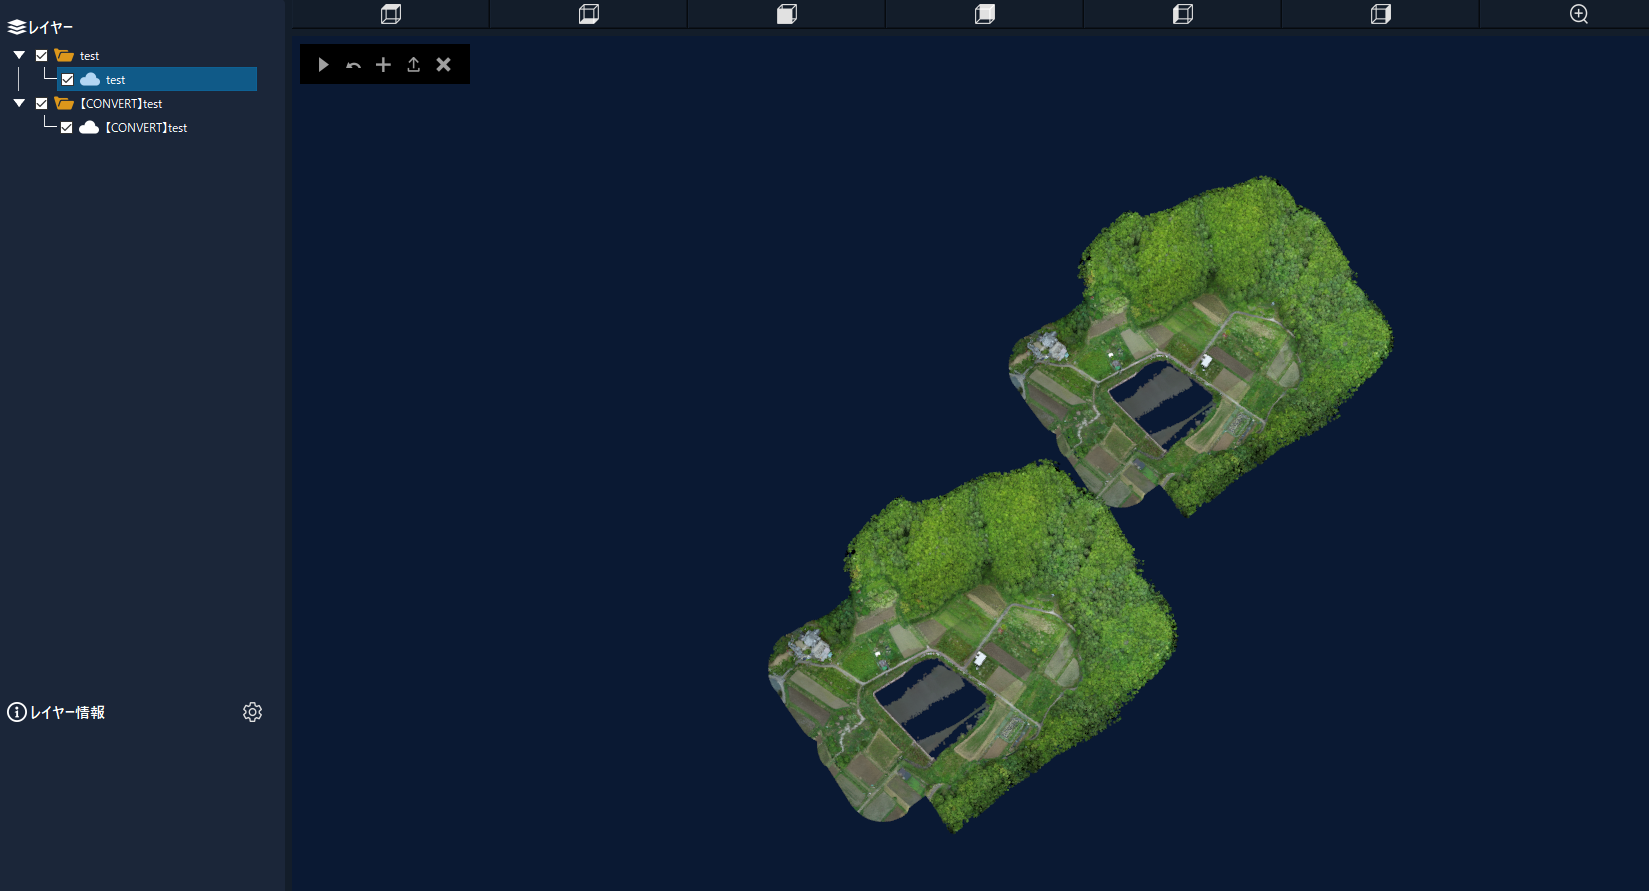
4.16.2.2 Manually input and select source coordinates
1. Select the point cloud to use from the layer.
2. Make sure the markers are imported.
3.Click on the coordinate transformation icon and select Translation → Transform using projected coordinate system → Click on the coordinates of the transformation source and select Select. 
4. The coordinate conversion dialog will appear. Enter the coordinates before conversion and the coordinates after conversion in the red frame, and press the "Convert point cloud" button. 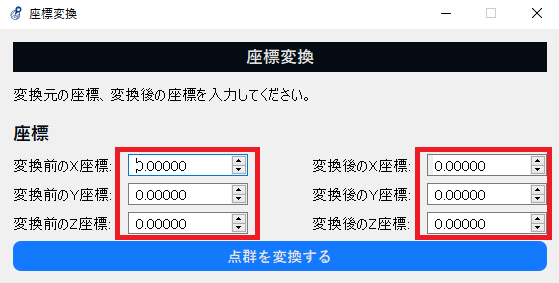
5. After loading, the transformed point cloud will be added. 
4.16.2 Helmert transformation
Perform Helmert transformation of the point cloud taken with LA01.
For fixed shooting data, see Helmert conversion method for fixed shooting .
For data taken while moving, see Helmert conversion method when shooting while moving .
4.16.2.1 For Helmert transformation during fixed shooting
1. Select the point cloud to use from the layer.
2. Make sure the markers are imported.
3.Click on the coordinate transformation icon and select Helmert transformation. 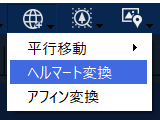
4. Click the OK button in the "Right-click to select two points to use for conversion" dialog.
5.Right-click on the location whose coordinates have been previously obtained using RTK, etc., select two points on the viewer, and press the start button on the top left. 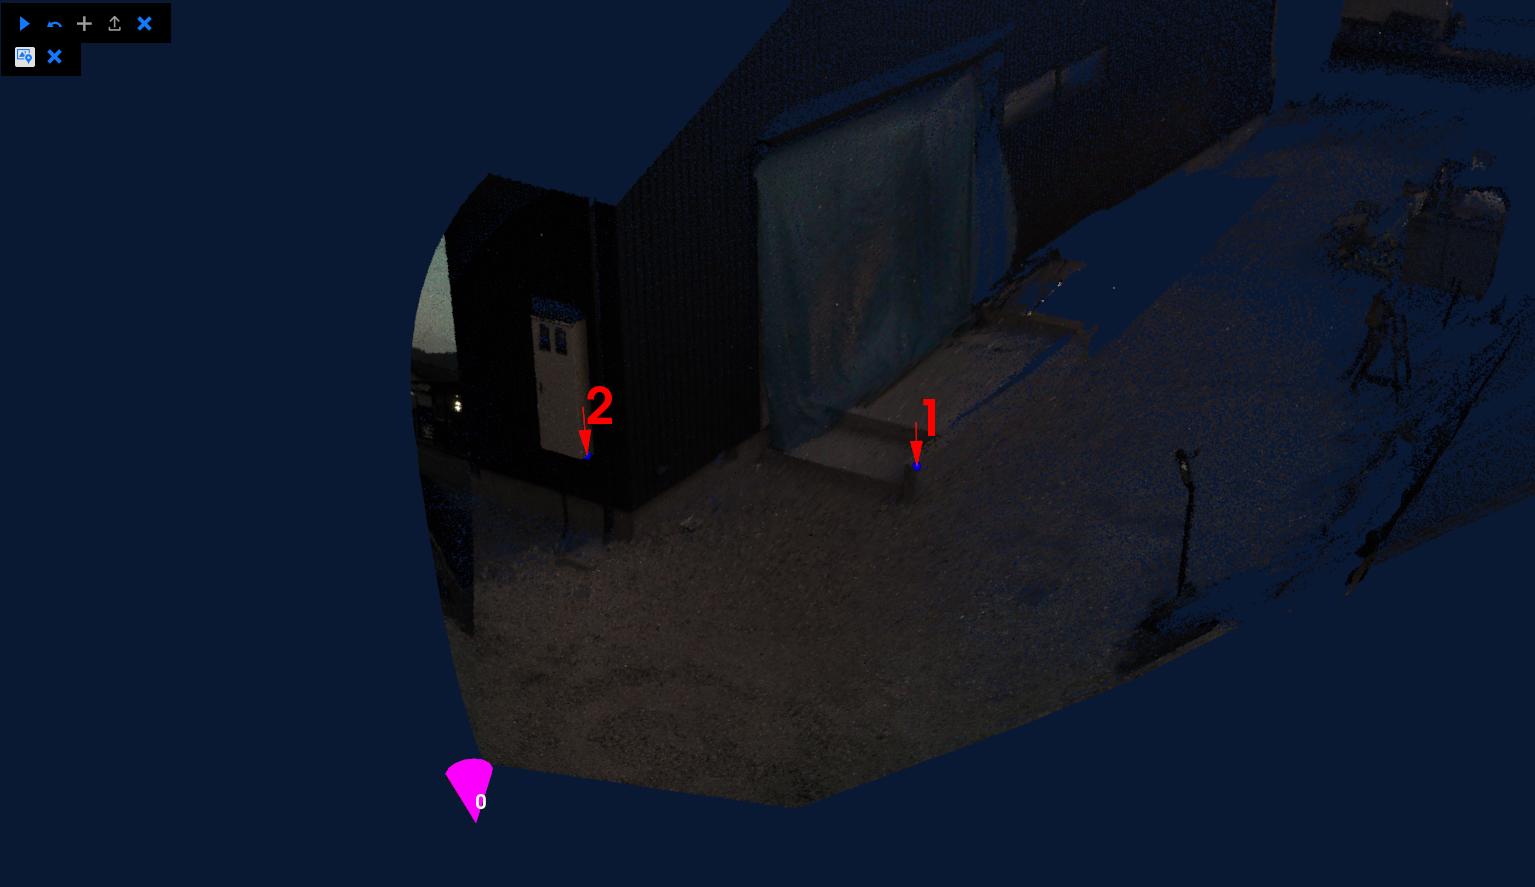
6. The settings screen will appear. Enter the converted coordinates of the two points in the red frame in the image below, and press "Convert point cloud." 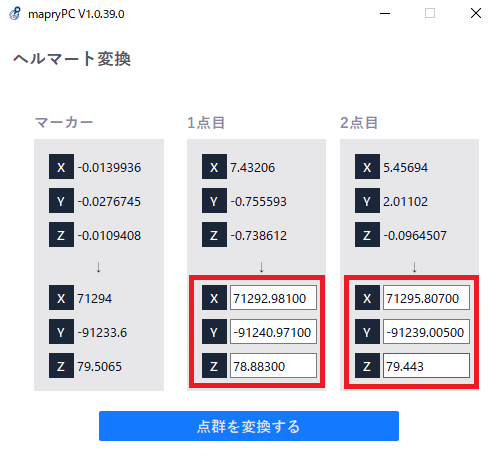
7. After the loading screen, the converted point cloud will be added. 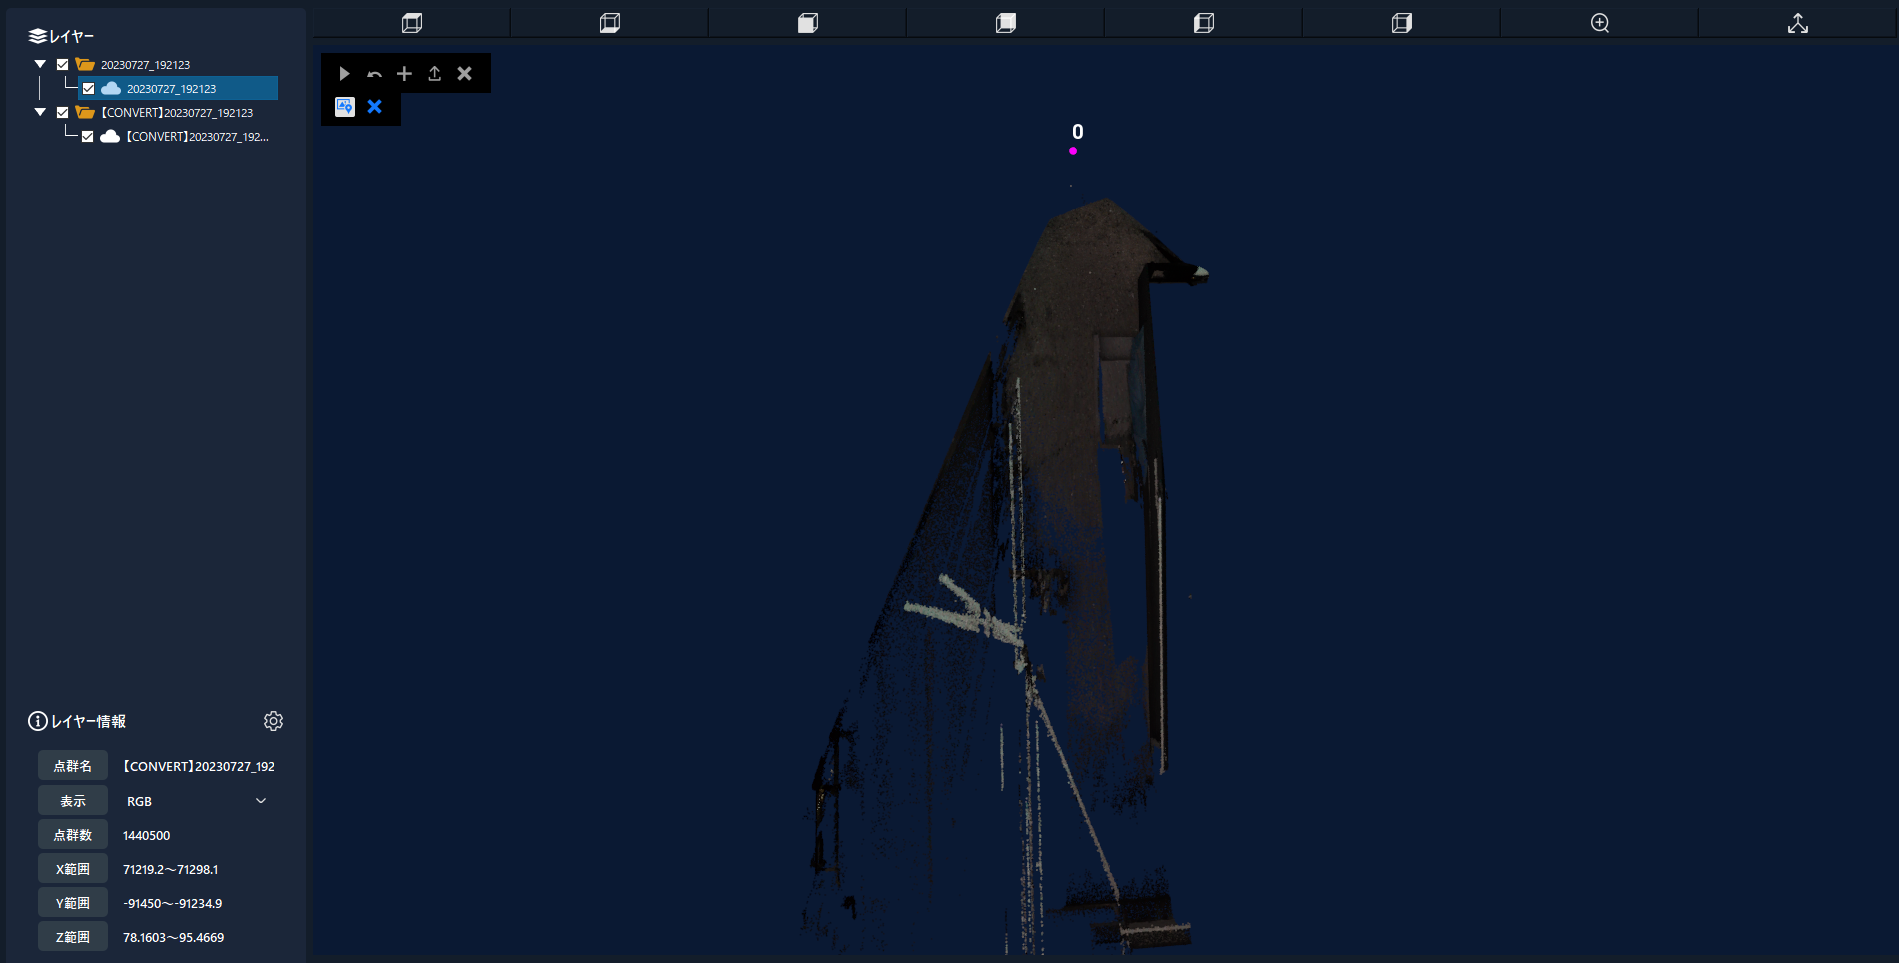
4.16.2.2 For Helmert transformation during moving shooting
1. Select the point cloud to use from the layer.
2. Make sure the markers are imported.
3.Click on the coordinate transformation icon and select Helmert transformation. 
4. After the loading screen, a new Helmert transformed point cloud will be added. 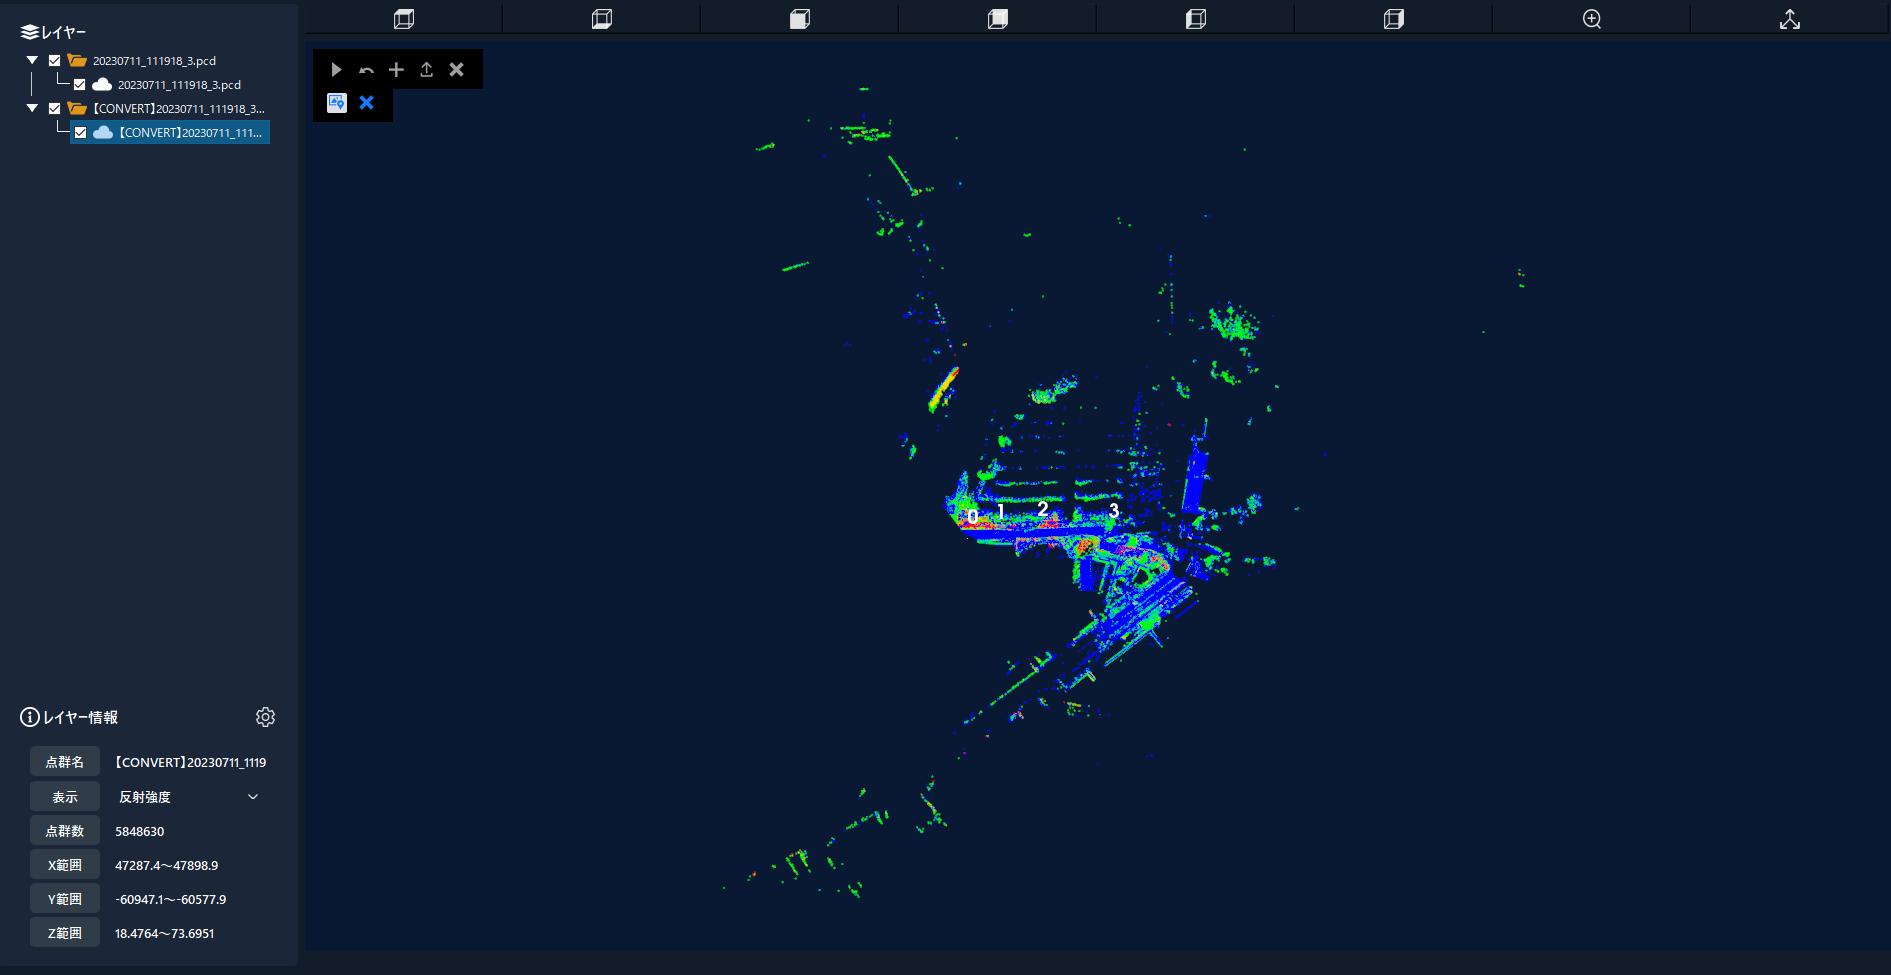
4.16.3 Affine transformation
Affine transformation is performed on the point cloud taken with LA01.
For data captured in a fixed position, please refer to the affine transformation method when shooting in a fixed position .
For data captured while moving, see affine transformation method when shooting while moving .
4.16.3.1 In the case of affine transformation during fixed shooting
1. Select the point cloud to use from the layer.
2. Make sure the markers are imported.
3.Click on the coordinate transformation icon and select affine transformation. 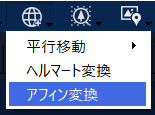
4. Click the OK button in the "Right-click to select three points to use for conversion" dialog.
5.Right-click on the location whose coordinates have been previously obtained using RTK, etc., select two points on the viewer, and press the start button on the top left. 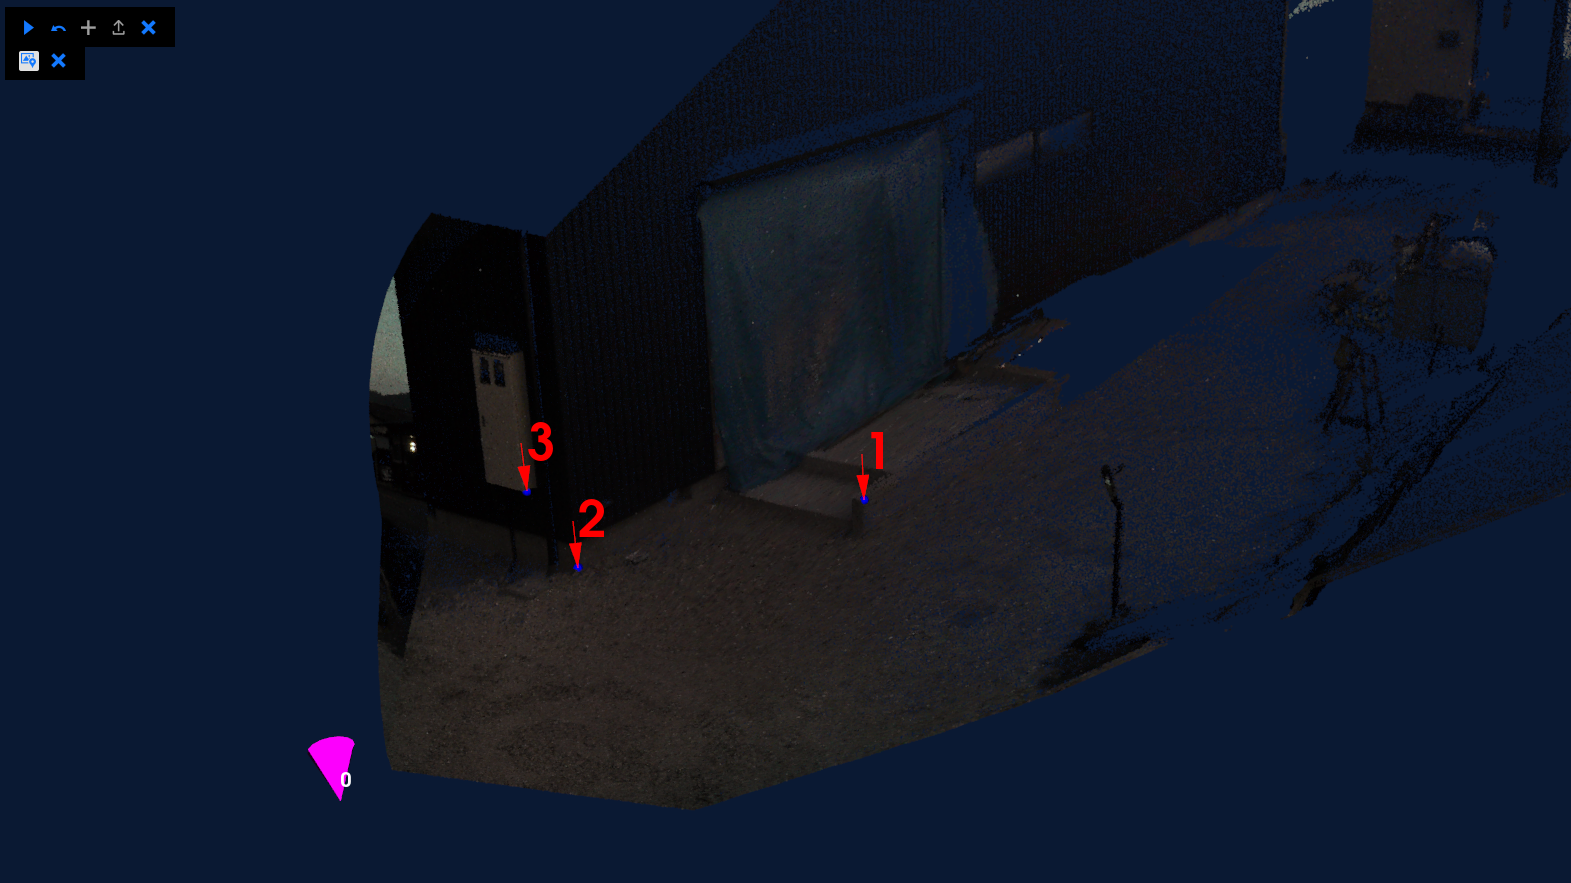
6. The settings screen will appear. Enter the converted coordinates of the three points in the red frame in the image below, and press "Convert point cloud." 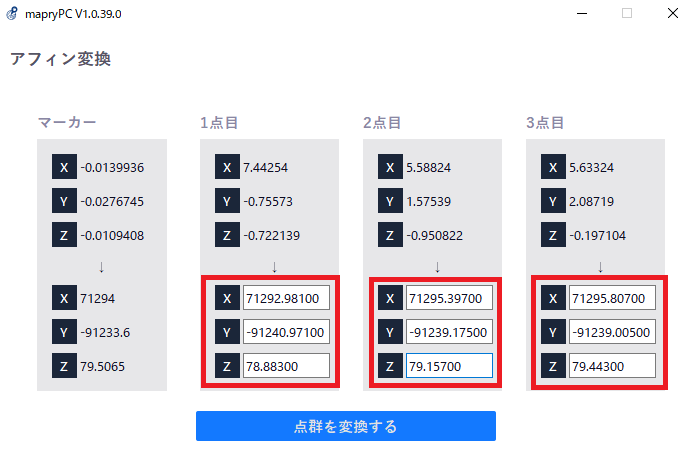
7. After the loading screen, the converted point cloud will be added. 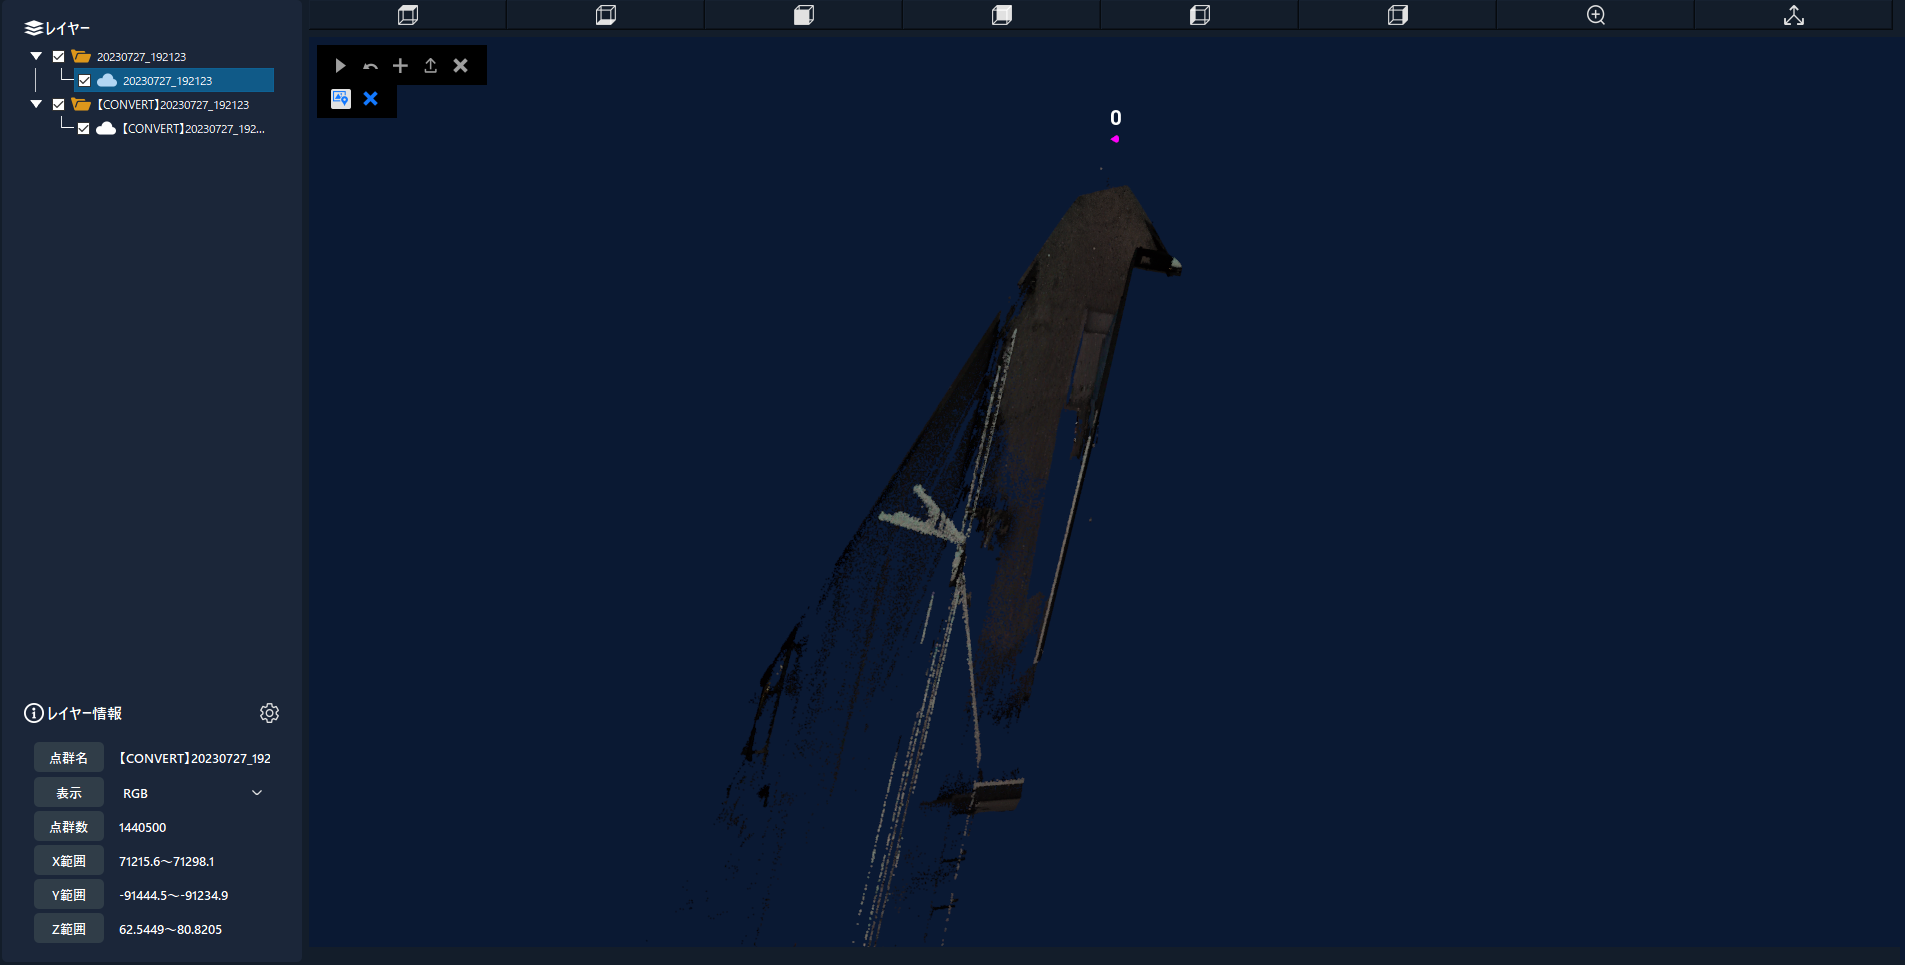
4.16.3.2 Affine transformation during moving shooting
1. Select the point cloud to use from the layer.
2. Make sure the markers are imported.
3.Click on the coordinate transformation icon and select affine transformation. 
4. After the loading screen, a new Helmert transformed point cloud will be added. 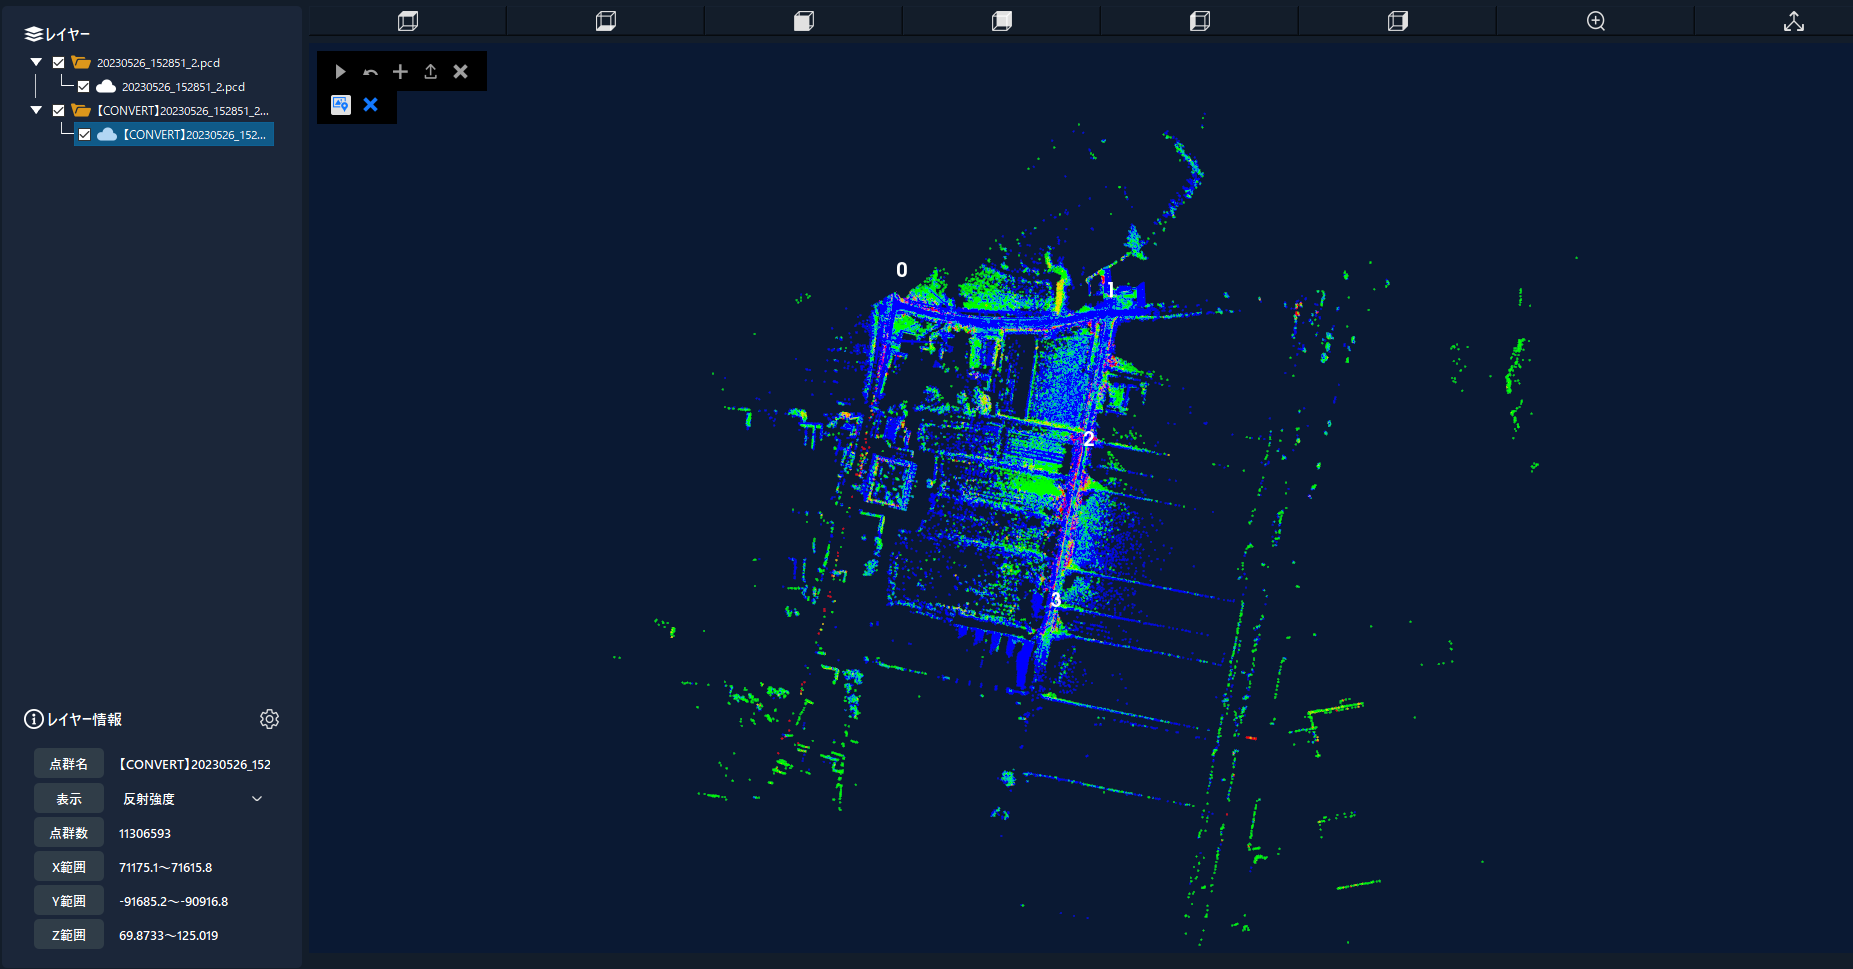
〇Note: Depending on the position of the marker and the coordinates after conversion, a point cloud with a greatly distorted shape may be output.
4.17. Tree detection 
Tree detection will be performed using the point cloud taken with LA01 and LA03.
〇Note: Depending on the size and scope of the point group, processing time may take longer.
4.17.1 Tree detection method
4.17.1.1 When detecting standing trees within the clicked range
1. Select the point cloud to use from the layer.
2.Click on the tree detection icon and select “Select area and detect tree”. 
3. Select "Measure by clicking" in the processing range selection method dialog and press the OK button. 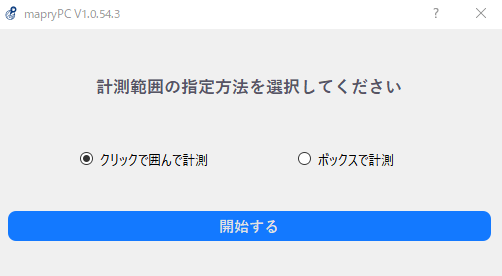
4. If you right-click and select three or more points, a polygon connecting the selected points will be displayed on the viewer.
If there is no problem with the detection range within the polygon, press the start button at the top left of the viewer.
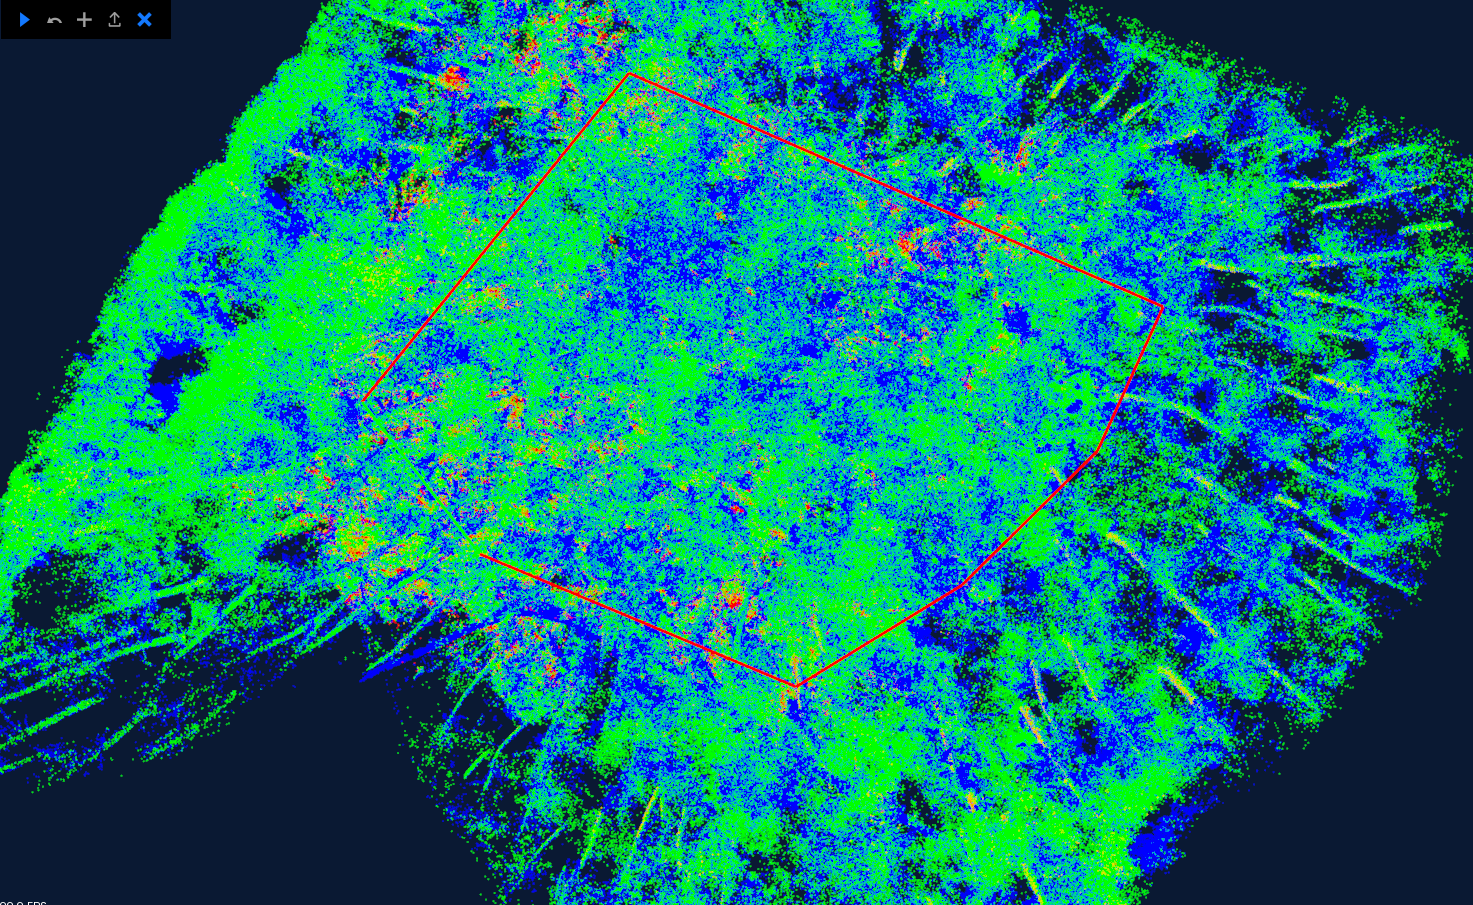
5. Please enter the standing tree detection settings screen.
After entering the tree detection settings, click the "Start detection" button to start tree detection.
Click here for the standing tree detection setting screen. 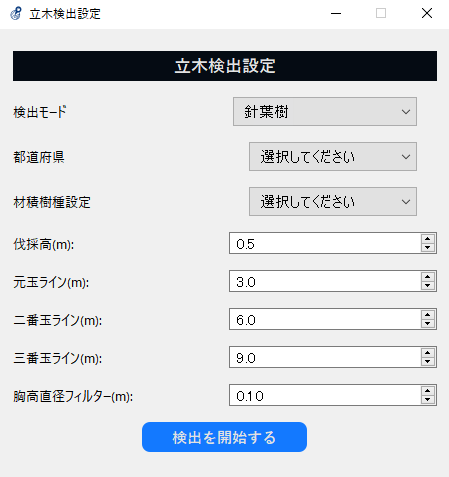
4.17.1.2 When detecting standing trees by specifying the length of the selection range
1. Select the point cloud to use from the layer.
2.Click on the tree detection icon and select “Select area and detect tree”. 
3. Select "Measure with box" in the processing range selection method dialog, and enter ① box height (m) and ② box width (m).
The specified height and width will be the size of the polygon to be selected.
When you have finished entering the height and width, press the OK button. 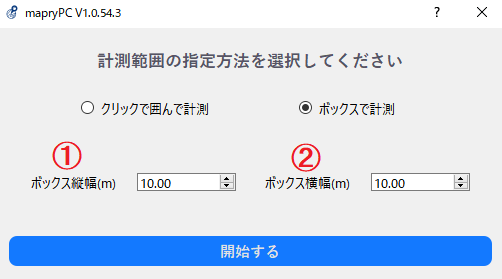
4. Move the selection by holding down the Shift key and moving the mouse on the viewer.
If you move the mouse while holding down the a button, the polygon will rotate.
After determining the range, press the start button at the top left of the viewer to confirm the range and display the tree detection setting screen. 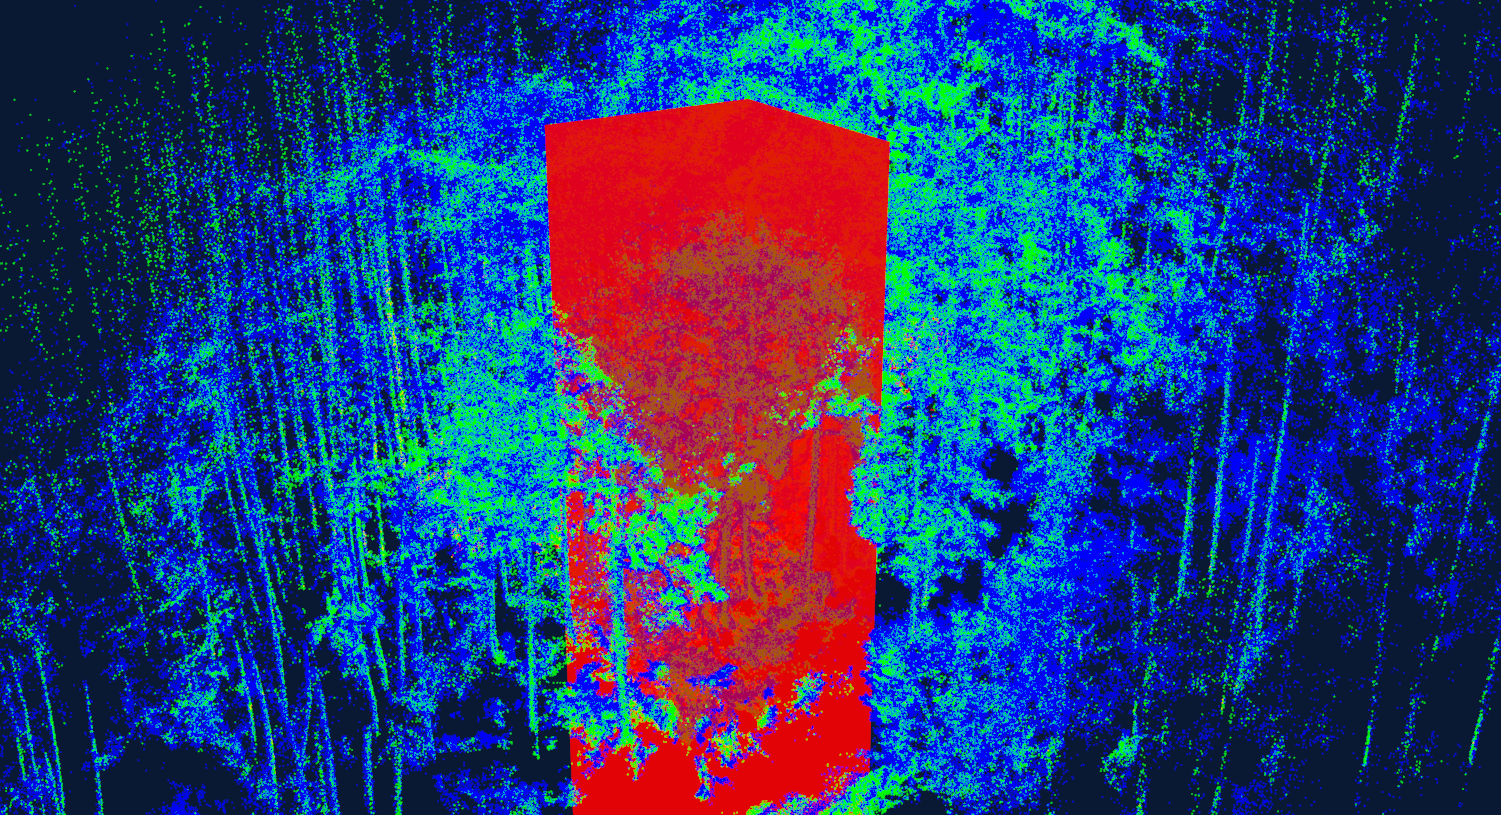
5.The tree detection setting screen will be displayed. After entering the tree detection settings, click the "Start detection" button to start tree detection. Click here for the standing tree detection setting screen.
4.17.1.3 When measuring a specified range from the route
1. Select the point cloud to use from the layer.
2. Check if the route is imported.
3.Click on the tree detection icon and select “Select area and detect tree”. 
4. Select "Measure by width around the route" in the processing range selection method dialog, and enter the radius (m) from the route.
Detects standing trees within a specified width range from the root.
When you have finished entering the width, press the OK button. 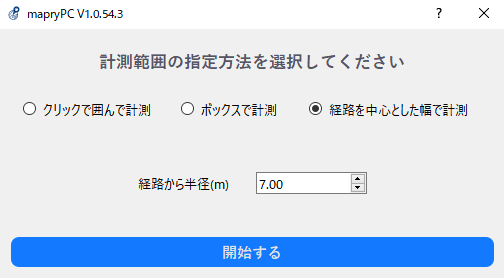
5. Please enter the standing tree detection settings screen.
After entering the tree detection settings, click the "Start detection" button to start tree detection.
Click here for the standing tree detection setting screen. 
4.17.1.4 When detecting standing trees within the marker range
1. Select the point cloud to use from the layer.
2. Make sure the markers are imported.
3.Click on the tree detection icon and select “Detect tree using marker”. 
4.The tree detection setting screen will be displayed. After entering the tree detection settings, click the "Start detection" button to start tree detection. Click here for the standing tree detection setting screen.
4.17.1.5 About the standing tree detection setting screen
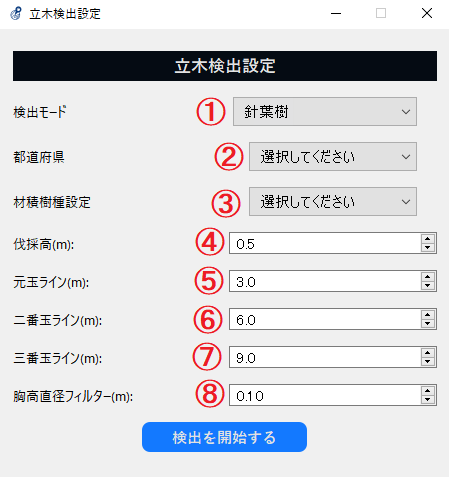
① Detection mode → Conifer → Conifer and hardwood (β version)
② Prefecture selection This will affect the volume after analysis.
③ Tree species selection This will affect the wood volume after analysis. Can be changed individually after analysis.
④ Cutting height (m) This is the height measured as cutting height.
⑤Original line (m) This is the height measured as the original line.
⑥ Second ball line (m) This is the height measured as the second ball.
⑦Third ball line (m) This is the height measured as the third ball.
⑧ Breast height diameter filter (m) Trees with a diameter less than the specified breast height will not be detected.
4.17.2 Standing tree detection result screen
When tree detection is complete, a cylinder will be displayed on the viewer at the location where a tree was detected, and a list of results will be displayed in a table below the viewer.
4.17.2.1 Standing tree detection result screen explanation
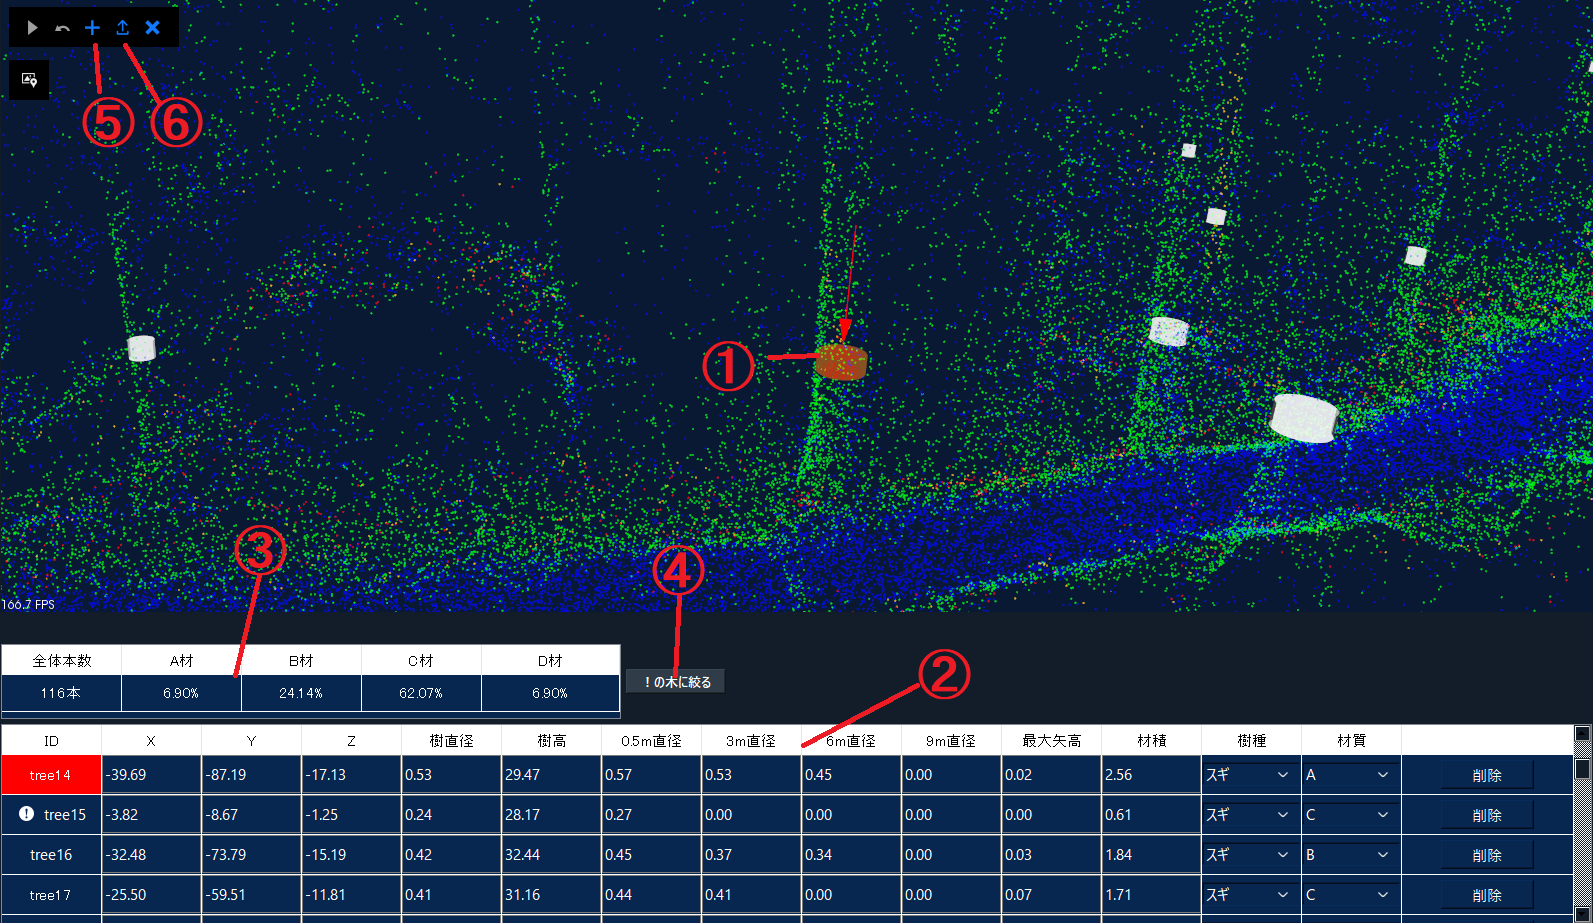
① A cylinder will be displayed at the location where a standing tree is detected. By right-clicking the cylinder, it will turn red and the detection result table will move to the corresponding data.
②List of standing tree detection results.
③ Ratio of detected number and material.
④! You can narrow down your search to only trees marked with a mark (trees that are suspicious of detection).
⑤You can add trees that were not detected. For details, see How to add standing tree detection results .
⑥ Output the detection results as a Shape file. For more information, please see how to output standing tree detection results as a Shape file.
4.17.2.2 How to edit standing tree detection results
You can change the detection results by scrolling or entering values in cells in the table. Below are some additional information about important columns.
・The X, Y, and Z columns show the detected coordinates. By changing this value, the coordinates of the corresponding cylinder on the viewer will move, allowing you to adjust the detection location.
・The tree diameter column shows the diameter at breast height of the detected standing trees. By changing this value, the diameter of the corresponding cylinder on the viewer will also change, allowing you to adjust the chest height diameter.
- If you press the Delete button and press Yes in the "Do you want to delete" dialog box, the corresponding row and cylinder on the viewer will be deleted.
4.17.2.3 How to add standing tree detection results
1.Press the plus button on the top left of the viewer. ![]()
2.Click the OK button in the "Right-click the location you want to add" dialog.
3.A red dot will appear at the location where you plan to add it, then right-click. 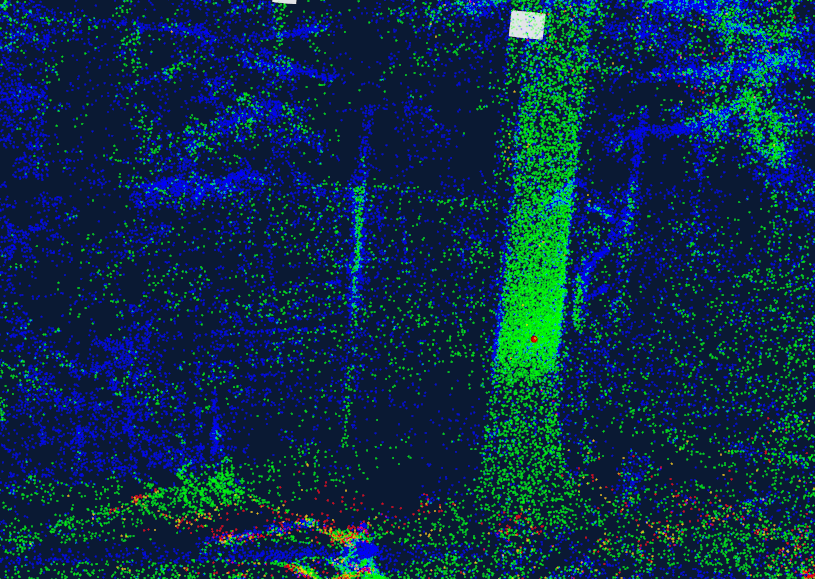
4.A new cylinder and a row will be added to the results table at the location you clicked. 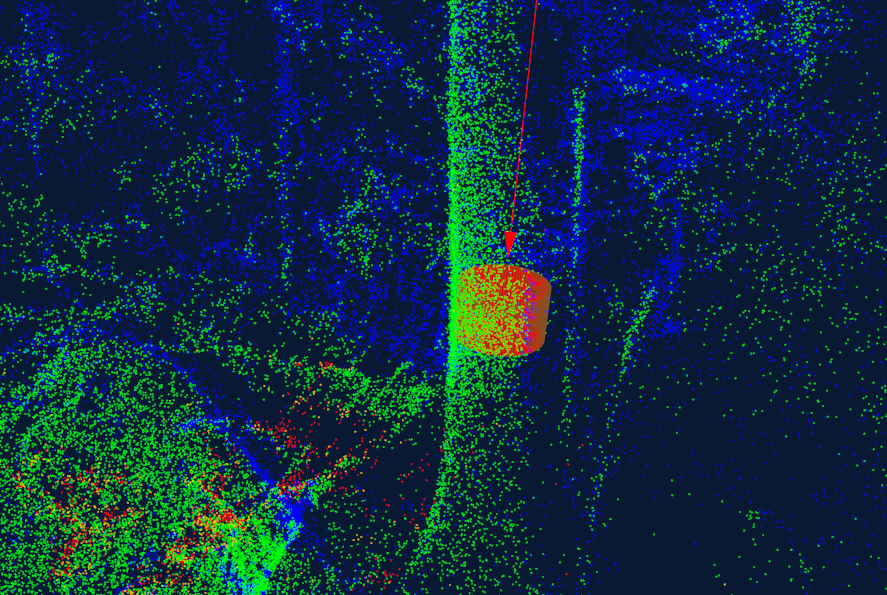
4.17.2.3 How to output standing tree detection results as a Shape file
1.Press the export button at the top left of the viewer. ![]()
2.In the Shape file output settings window, press the button ① to specify the output file path (zip), select the coordinate system ②, and press the start button. 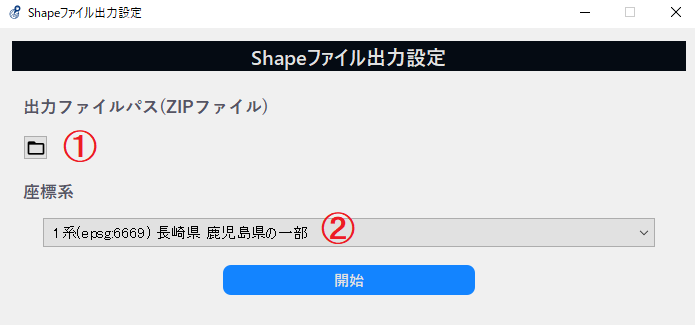
3. After the loading screen, the Shape file will be saved in the specified path in zip format.
4.18. Laser drone 
Load or orthorectify data acquired with the laser drone (M1).
Select the icon and select the laser drone data directory to start processing.
4.18.1 Loading laser drone (M1) data
Outputs colored point cloud data from the point cloud data and images acquired by the drone app.
- Click on the laser drone icon from the toolbar .
Next, click "Load M1 data".
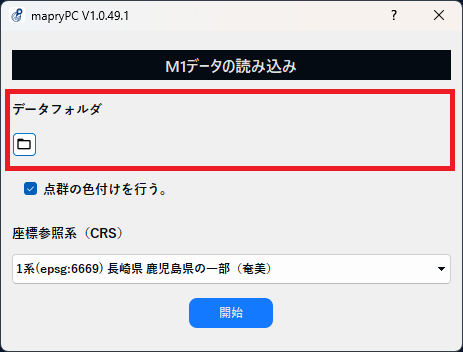
- Select the laser drone data folder.
- Check this if you want to create a colored point cloud.
*The coloring process may take some time to load, so please uncheck it if it is not necessary.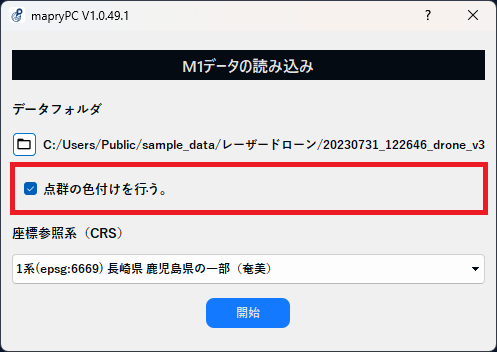
- Select the reference coordinate system (CRS).
The coordinate system can be selected from the Japanese Geodetic System 2011 system 1 (epsg:6669) to system 19 (epsg:6687).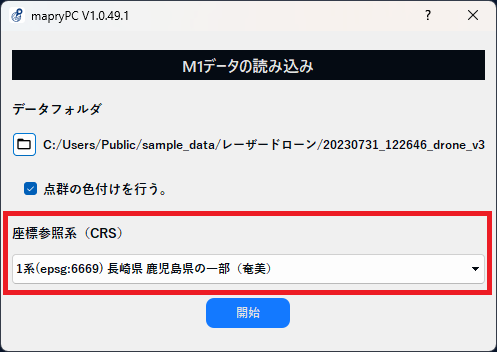
- After entering each item, click the "Start" button to start loading the point cloud.
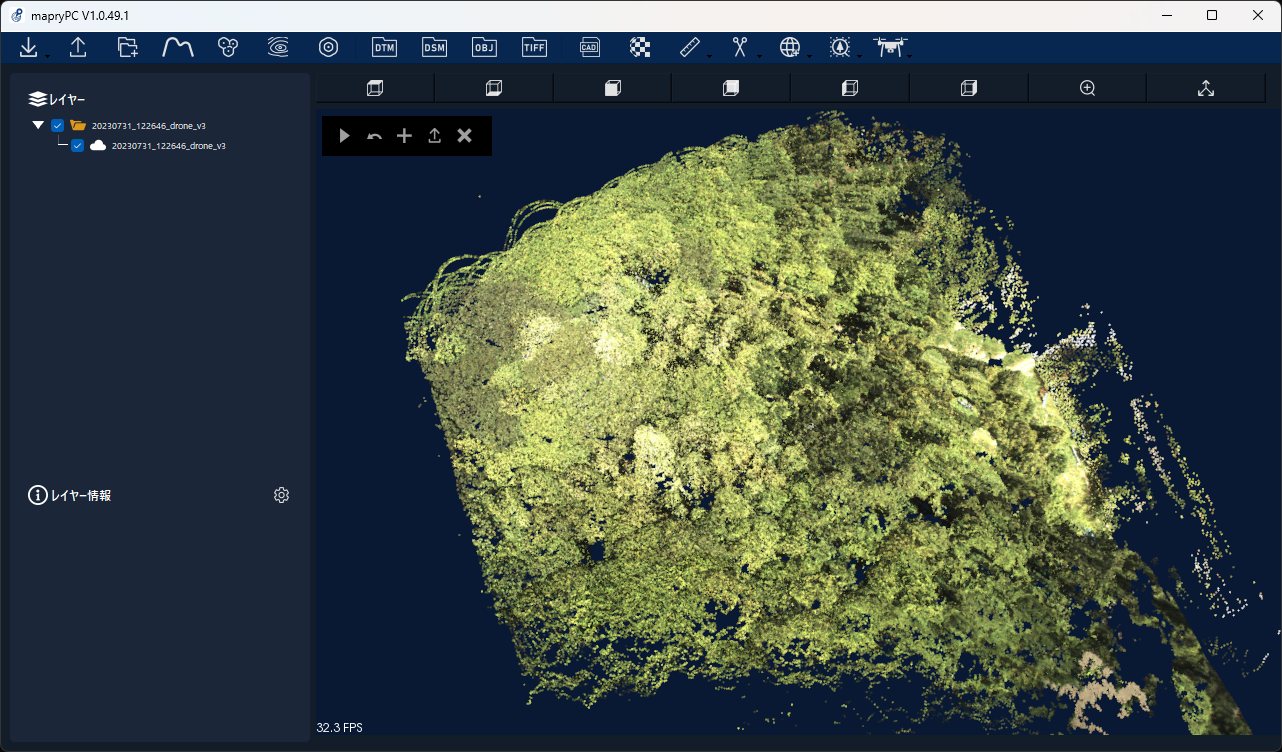
- Once loading is complete, the point cloud will be displayed in the viewer.
4.18.2 Creating orthoimages from laser drone (M1) data
- Click the Drone Processing icon from the toolbar .
Next, click "Create orthoimage from M1 data".
- Select the drone data folder.
Click the "Select Folder" button to start ortho correction.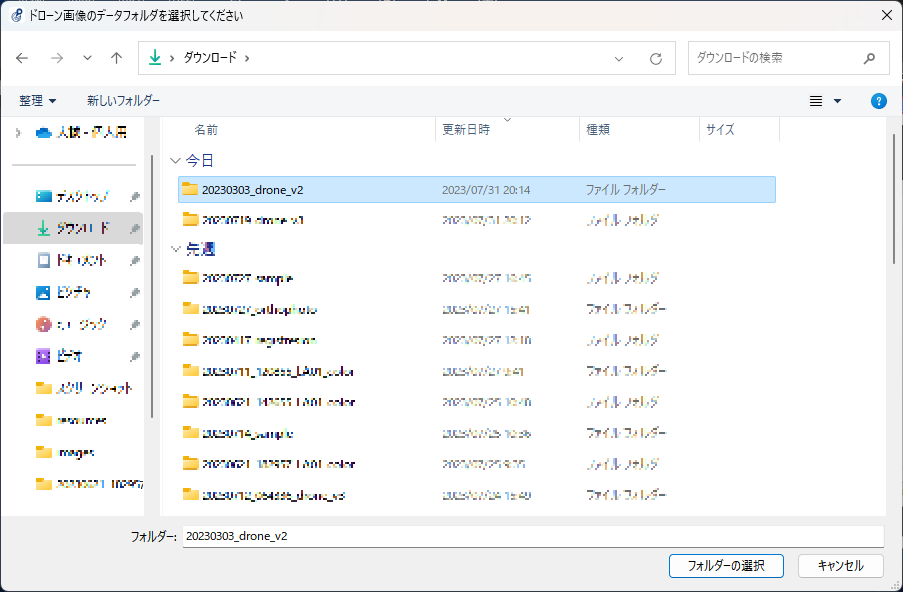
- Once the processing is complete, the ortho image will be displayed.
You can save an ortho image in TIFF format (.tif) using the "Save ortho image" button.